
Videos
Compute the price relatives for the four stocks making up the Boran index in exercise 20. Use the weighted aggregates of price relatives to compute the January 2011 and March 2011 Boran indexes.
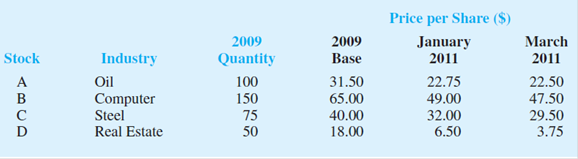
20. Boran Stockbrokers, Inc., selects four stocks for the purpose of developing its own index of stock market behavior. Prices per share for a 2009 base period, January 2011, and March 2011 follow. Base-year quantities are set on the basis of historical volumes for the four stocks.
Use the 2009 base period to compute the Boran index for January 2011 and March 2011. Comment on what the index tells you about what is happening in the stock market.
Find the price relatives for the four stocks making up the Boran index in Exercise 20.
Find the January 2011 and March 2011 Boran indexes by using the weighted aggregates of price relatives.
Answer to Problem 21SE
The price relatives for the four stocks for January 2011 are obtained below:
| Year | 2009 Base | January 2011 | |
| Oil | 31.50 | 22.75 | 72.2 |
| Computer | 65 | 49 | 75.4 |
| Steel | 40 | 32 | 80 |
| Real Estate | 18 | 6.50 | 36.1 |
The price relatives for the four stocks for March 2011 is obtained below:
| Year |
2009 Base | March 2011 | |
| Oil | 31.50 | 22.50 | 71.4 |
| Computer | 65 | 47.50 | 73.1 |
| Steel | 40 | 29.50 | 73.8 |
| Real Estate | 18 | 3.75 | 20.8 |
The Boran index for January 2011 by using the weighted aggregates of price relatives is 73.5.
The Boran index for March 2011 by using the weighted aggregates of price relatives is 70.10.
Explanation of Solution
Calculation:
The data represents the price per share for the periods January 2011, March 2011 and 2009 Base. Furthermore, the values of 2009 Quantity are also given.
The price relatives for the four stocks for January 2011 are obtained below:
| Year | 2009 Base | January 2011 | |
| Oil | 31.50 | 22.75 | |
| Computer | 65 | 49 | |
| Steel | 40 | 32 | |
| Real Estate | 18 | 6.50 |
The price relatives for the four stocks for March 2011 is obtained below:
| Year |
2009 Base | March 2011 | |
| Oil | 31.50 | 22.50 | |
| Computer | 65 | 47.50 | |
| Steel | 40 | 29.50 | |
| Real Estate | 18 | 3.75 |
The Boran index for January 2011 and March 2011 by using the weighted aggregates of price relatives is obtained below:
Thus, the Boran index for January 2011 by using the weighted aggregates of price relatives is 73.5.
The Boran index for March 2011 by using the weighted aggregates of price relatives is obtained below:
Thus, the Boran index for March 2011 by using the weighted aggregates of price relatives is 70.10.
Want to see more full solutions like this?
Chapter 20 Solutions
Statistics for Business & Economics, Revised (MindTap Course List)


- The following information is taken from Johnson & Johnson's annual reports. Its common stock is listed on the New York Stock Exchange, using the symbol JNJ. Johnson & Johnson Domestic Sales International Sales Employees Year ($ million) $ Million Thousands 2010 29,437 32,124 114.0 2011 12,907 36,107 117.9 2012 29,830 37,394 127.6 2013 31,910 39,402 128.1 2014 34,782 39,548 126.5 2015 35,687 34,387 127.1 2016 37,811 34,079 126.4 2017 39,863 36,597 134.0 2018 41,884 39,697 135.1 Using the period 2010–12 as the base period, compute a simple index of international sales for each year from 2013 to 2018. (Round your answers to 1 decimal place.)The index (2010–2012 = 100) for selected years is: Year Index 2010 2011 2012 2013 2014 2015 2016 2017 2018 I have asked this question a few times and it hasn't been correct. I am very confused on this on. Also, am I putting anything for the…arrow_forwardThe following information is taken from Johnson & Johnson's annual reports. Its common stock is listed on the New York Stock Exchange, using the symbol JNJ. Johnson & Johnson Domestic Sales International Sales Employees Year ($ million) ($ million) (thousands) 2010 $ 29,437 $ 32,124 114.0 2011 12,907 36,107 117.9 2012 29,830 37,394 127.6 2013 31,910 39,402 128.1 2014 34,782 39,548 126.5 2015 35,687 34,387 127.1 2016 37,811 34,079 126.4 2017 39,863 36,587 134.0 2018 41,884 39,697 135.1 Using the period 2010–12 as the base period, compute a simple index of international sales for each year from 2013 to 2018. (Round your answers to 1 decimal place.)The index (2010–2012 = 100) for selected years is:arrow_forwardThe following information is taken from Johnson & Johnson's annual reports. Its common stock is listed on the New York Stock Exchange, using the symbol JNJ. Johnson & Johnson Domestic Sales International Sales Employees Year ($ million) ($ million) (thousands) 2010 $ 29,437 $ 32,124 114.0 2011 12,907 36,107 117.9 2012 29,830 37,394 127.6 2013 31,910 39,402 128.1 2014 34,782 39,548 126.5 2015 35,687 34,387 127.1 2016 37,811 34,079 126.4 2017 39,863 36,587 134.0 2018 41,884 39,697 135.1arrow_forward
- Boran Stockbrokers, Inc., selects four stocks for the purpose of developing its own index of stock market behavior. Prices per share for a year 1 base period, January year 3, and March year 3 follow. Base-year quantities are set on the basis of historical volumes for the four stocks. Stock Industry Year 1Quantity Price per Share ($) Year 1Base JanuaryYear 3 MarchYear 3 A Oil 100 33.50 20.75 22.50 B Computer 150 65.00 49.00 47.50 C Steel 75 40.00 32.00 29.50 D Real Estate 50 18.00 6.50 4.75 Compute the price relatives for the four stocks making up the Boran index. (Round your answers to one decimal place.) Stock Price Relative Stock January March A ?? ? B ? ? C ? ? D ? ? Use the weighted average of price relatives to compute the January year 3 and March year 3 Boran indexes. (Round your answers to one decimal place.) IJan=?? IMar=??arrow_forwardBoran Stockbrokers, Inc., selects four stocks for the purpose of developing its own index of stock market behavior. Prices per share for a year 1 base period, January year 3, and March year 3 follow. Base-year quantities are set on the basis of historical volumes for the four stocks. Stock Industry Year 1Quantity Price per Share ($) Year 1Base JanuaryYear 3 MarchYear 3 A Oil 100 29.50 24.75 22.50 B Computer 150 65.00 49.00 47.50 C Steel 75 40.00 33.00 29.50 D Real Estate 50 18.00 6.50 3.75 -Compute the price relatives for the four stocks making up the Boran index. (Round your answers to one decimal place.) Stock Price Relative January March A B C D Use the weighted average of price relatives to compute the January year 3 and March year 3 Boran indexes. (Round your answers to one decimal place.)arrow_forwardConstruct the following Weighted Aggregative Price index for 2021 on the basis of 2017 data; Laspeyer’s Index Paasche’s Index Fisher’s Ideal Index Dorbish and Bowley’s Index Commodity Prices Quantities 2017 2021 2017 2021 A 150 330 8000 11000 B 55 105 700 650 C 4420 9000 30 35 D 700 1334 475 365 E 320 320 436 780arrow_forward
- A recent report by PEW Research Center, published on February 25, 2022 summarizes American views on Russia threat as follows. “When it comes to rising U.S.- Russia tensions, an early January survey found that 26% of Americans considered the Russian military buildup near Ukraine to be a major threat to U.S. interests, while 33% said it was a minor threat to U.S. interests. Another 7% said it was no threat at all. A relatively large share of U.S. adults (33%) said they were not sure how Russian actions toward Ukraine affected U.S. interests.” Answer the questions based on the proportions listed above. (a) Use the binomial distribution to estimate the probability that more than half of 20 randomly selected US adults consider Russian military buildup near Ukraine to be a major or a minor threat to U.S. interests. (b) Use the normal approximation to estimate the probability that more than half of 20 randomly selected US adults consider Russian military buildup near Ukraine to be a major or…arrow_forwardThe following table presents the manufacturer’s suggested retail price (in $1000s) for base models and styles of BMW automobiles. 35.3 37.3 41.1 43.1 40.0 45.0 47.0 53.1 55.1 46.8 51.4 53.4 57.7 64.0 51.2 53.2 86.5 89.5 95.6 102.7 58.9 54.8 47.8 50.4 52.4 54.0 56.0 69.2 77.7 103.1 137.7 69.9 76.9 73.4 80.4 63.5 a. Construct (fill out) a frequency distribution using 5 classes that have a class width of 21. Begin with a lower limit of 35. Include the classes, boundaries or midpoints, frequency, and relative frequency. Class Frequency Relative Frequency Boundaries or midpoints (your choice) b. Draw a frequency or relative frequency histogram. Completely label your axis and place a title on your graph.arrow_forwardA company that sells digital devices has its stores in several cities in Albania. The Marketing Manager plans to transmite an advertisement for the digital camera product on local television and watch sales of that product, to see the link that exists with the number of ads transmitted and product sales. After two days, the results were presented in the following table: City Trasmitted Sales(in 000 Euro) Durrës 4 15 Sarandë 2 8 Fier 5 21 Berat 6 24 Lezhë 3 17 S S = 1.58 S = 6.1 a) What is the dependent variable?b) Construct the scatterdiagram of this connection.c) Calculate the coefficient of variation and the coefficient of determination.d) Interpret the relationship between two variables.e) What is the equation that connects these two variables? Explain the values for a and b.f) What is the expected level of sales if 10 ads are trasmittedarrow_forward
- Assuming the market research was done properly and the 40% is representative, how many sales are expected if the publisher attempts to sell to 5,000 homes?arrow_forwardThe following table shows a data set containing information for 25 of the shadow stocks tracked by the American Association of Individual Investors. Shadow stocks are common stocks of smaller companies that are not closely followed by Wall Street analysts. How many variables are in the data set? Which of the variables are categorical and which are quantitative? For the Exchange variable, show the frequency and the percent frequency for AMEX, NYSE, and OTC. Construct a bar graph similar to Figure 1.4 (in the textbook) for the Exchange variable. Show the frequency distribution for the Gross Profit Margin using he five intervals: 0 – 14.9, 15 – 29.9, 30 – 44.9, 45 – 59.9, and 60 – 74.9. Construct a histogram similar to Figure 1.5 (in the textbook). What is the average price/earnings ratio? DATA SET FOR 25 SHADOW STOCKS Company Exchange Ticker Symbol Market Cap ($ millions) Price/ Earnings Ratio Gross Profit Margin (%) DeWolfe Companies AMEX DWL 36.4…arrow_forward3.6 With the increase in the mobility of the population in the United States and with the increasein home-based employment, there is an inclination to assume that the personal income in theUnited States will become fairly uniform across the country. The following table provides the percapita personal income for each of the 50 states and the District of Columbia.Income(thousands of dollars) Number of States22.0–24.9 525.0–27 .9 1328.0–30.9 1631.0–33.9 934.0–36.9 437 .0–39.9 240.0–42.9 2 Total 51 a. Construct a relative frequency histogram for the income data.b. Describe the shape of the histogram using the standard terminology ofhistograms.c. Would you describe per capita income as being fairly homogenous across…arrow_forward
 MATLAB: An Introduction with ApplicationsStatisticsISBN:9781119256830Author:Amos GilatPublisher:John Wiley & Sons Inc
 Probability and Statistics for Engineering and th...StatisticsISBN:9781305251809Author:Jay L. DevorePublisher:Cengage Learning
 Statistics for The Behavioral Sciences (MindTap C...StatisticsISBN:9781305504912Author:Frederick J Gravetter, Larry B. WallnauPublisher:Cengage Learning
 Elementary Statistics: Picturing the World (7th E...StatisticsISBN:9780134683416Author:Ron Larson, Betsy FarberPublisher:PEARSON
 The Basic Practice of StatisticsStatisticsISBN:9781319042578Author:David S. Moore, William I. Notz, Michael A. FlignerPublisher:W. H. Freeman
 Introduction to the Practice of StatisticsStatisticsISBN:9781319013387Author:David S. Moore, George P. McCabe, Bruce A. CraigPublisher:W. H. Freeman