
Videos
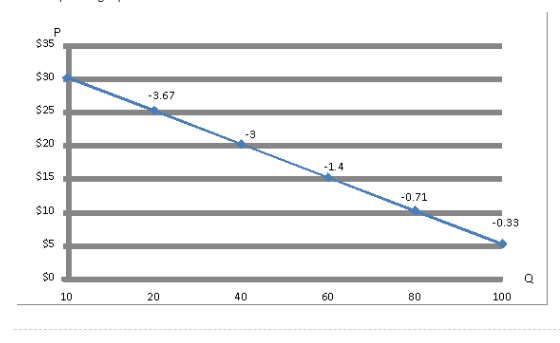
Plot the price and quantity data given in the demand schedule of exercise 1. Put price on the vertical axis and quantity on the horizontal axis. Indicate the price elasticity value at each quantity demanded. Explain why the elasticity value gets smaller as you move down the demand curve.
Reason behind the elasticity value getting smaller with the downward movement on demand curve.
Explanation of Solution
The required graph is below:
- The arc or mid- point elasticity is calculated as follows:
Elasticity of Demand (Ed)
Where Ed = coefficient of elasticity
P1 = Initial Price
P2 = New Price
Q1 = Initial Quantity
Q2 = New Quantity
At price $5 per unit, quantity demanded = 100 units
At price $10 per unit, quantity demanded = 80 units
Thus, at the first point where price = $5 per unit, quantity demanded = 100 units
P1= $10 P2 = $5
Q1 = 80 Q2 = 100
Price elasticity of demand = -0.33
At price $10 per unit, the quantity demanded is 80 units, elasticity of demand is calculated as follows:
P1= $10 P2 = $15
Q1 = 80 Q2 = 60
At price $10 per unit, price elasticity of demand is -0.71.
At price $15 per unit, quantity demanded is 60 units, elasticity is calculated as follows:
P1 = $15 P2= $20
Q1 = 60 Q2= 40
Thus, at price $15 per unit, price elasticity of demand is -1.4
At price $20 per unit, quantity demanded is 40 units, sp, elasticity is calculated as follows:
P1 = $25 P2= $25
Q1 = 40 Q2= 20
Thus, at price $20 per unit, price elasticity of demand is -3.
At price $25 per unit, quantity demanded is 20 units, so, elasticity is calculated as follows:
P1 = $25 P2= $30
Q1 = 20 Q2= 10
Thus, at price $25 per unit, price elasticity of demand is -3.67
b)
Using price changes of $10, we compare the price and quantity changes with $10 increments. We will still follow the same mid point formula.
At price $5 per unit, quantity demanded is 100 units and at price $15 per unit, the quantity demanded is 60 units, thus elasticity at $5 per unit is:
P1 = $5 P2= $15
Q1 = 100 Q2= 60
Thus, at price $5 with price changes of $10, price elasticity of demand is -0.5
At price $10 per unit, the quantity demanded is 80 units and at price $20 per unit, quantity demanded is 40 units, thus elasticity at $10 per unit is:
Thus, at price $10 with price changes of $10, price elasticity of demand is -1
At price $15 per unit, the quantity demanded is 60 units and at price $25 per unit, quantity demanded is 20 units, thus elasticity at $15 per unit is:
Thus, at price $15 with price changes of $10, price elasticity of demand is -2
At price $20 per unit, the quantity demanded is 40 units and at price $30 per unit, quantity demanded is 10 units, thus elasticity at $25 per unit is:
Price elasticity (Ed) is the ratio of percentage change in quantity demanded upon percentage change in price.
Want to see more full solutions like this?


- Estimates presented in Exhibit 5 show that Android users have a higher price elasticity of demand for apps in the Google Play Store than do iPhone users in the Apple App Store. Why might Android users tend to be more sensitive to app prices than iPhone users? What categories or types of apps (for example, games/social media) do you think have the highest price elasticities?arrow_forwardOn Tuesday, the price and quantity demanded are 7 and 120 units, respectively. Ten days later, the price and quantity demanded are 6 and 150 units, respectively. What is the price elasticity of demand between the 7 and 6 prices?arrow_forwardProve that price elasticity of demand is not the same as the slope of a demand curve.arrow_forward
- What does a price elasticity of demand of 0.39 mean?arrow_forwardUsing the following equation for the demand for a good or service, calculate the price elasticity of demand (using the point form), cross-price elasticity with good x and income elasticity. Q=82P+0.10I+Px Q is quantity demanded, P is the product price. P1 is the price of a related good, and I is income. Assume that P= $10, I = 100, and Px = 20.arrow_forward

 Economics (MindTap Course List)EconomicsISBN:9781337617383Author:Roger A. ArnoldPublisher:Cengage Learning


