
STATISTICS F/BUSINESS+ECONOMICS-TEXT
13th Edition
ISBN: 9781305881884
Author: Anderson
Publisher: CENGAGE L
expand_more
expand_more
format_list_bulleted
Concept explainers
Videos
Textbook Question
Chapter 20.2, Problem 1E
The following table reports prices and usage quantities for two items in 2009 and 2011.
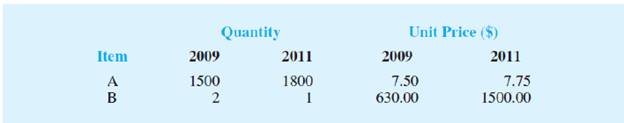
- a. Compute price relatives for each item in 2011 using 2009 as the base period.
- b. Compute an unweighted aggregate price index for the two items in 2011 using 2009 as the base period.
- c. Compute a weighted aggregate price index for the two items using the Laspeyres method.
- d. Compute a weighted aggregate price index for the two items using the Paasche method.
Expert Solution & Answer

Trending nowThis is a popular solution!

Students have asked these similar questions
Construct the following Weighted Aggregative Price index for 2021 on the basis of 2017 data;
Laspeyer’s Index
Paasche’s Index
Fisher’s Ideal Index
Dorbish and Bowley’s Index
Commodity
Prices
Quantities
2017
2021
2017
2021
A
150
330
8000
11000
B
55
105
700
650
C
4420
9000
30
35
D
700
1334
475
365
E
320
320
436
780
The following table presents prices, in thousands of dollars, of single-family homes for
20 of the largest metropolitan areas in the United States for the first quarter of
2012 and the first quarter of 2013.
.
Metro Area
2012
2013
Boston, MA
311.5
332.2
Chicago, IL
157.2
159.4
Cincinnati, OH
112.5
121.0
Cleveland, OH
84.9
101.0
Dallas, TX
148.2
160.4
Denver, CO
226.4
261.2
Houston, TX
152.1
163.7
Los Angeles, CA
122.1
155.1
Miami, FL
182.0
219.9
Minneapolis, MN
147.3
170.6
Metro Area
2012
2013
New York, NY
363.8
368.2
Philadelphia, PA
193.5
197.7
Phoenix, AZ
129.9
169.0
Portland, OR
208.6
246.5
Riverside, CA
174.3
216.7
St. Louis, MO
103.7
111.0
San Diego, CA
359.5
412.3
San Francisco, CA
448.0…
Dave Fletcher, the general manager of North Carolina
Engineering Corporation (NCEC), thinks that his firm’s engineer-ing services contracted to highway construction firms are directly
related to the volume of highway construction business contractedwith companies in his geographic area. He wonders if this is reallyso, and if it is, can this information help him plan his operationsbetter by forecasting the quantity of his engineering servicesrequired by construction firms in each quarter of the year? Thefollowing table presents the sales of his services and total amountsof contracts for highway construction over the past eight quarters:
a) Using this data, develop a regression equation for predictingthe level of demand of NCEC’s services.
b) Determine the coefficient of correlation and the standard errorof the estimate.
Chapter 20 Solutions
STATISTICS F/BUSINESS+ECONOMICS-TEXT
Ch. 20.2 - The following table reports prices and usage...Ch. 20.2 - An item with a price relative of 132 cost 10.75 in...Ch. 20.2 - A large manufacturer purchases an identical...Ch. 20.2 - Prob. 4ECh. 20.2 - Under the last-in, first-out (LIFO) inventory...Ch. 20.3 - Price relatives for three items, along with...Ch. 20.3 - The Mitchell Chemical Company produces a special...Ch. 20.3 - Prob. 8ECh. 20.3 - Compute the price relatives for the RB Beverages...Ch. 20.5 - Registered nurses in 2007 made an average hourly...
Ch. 20.5 - The average hourly wage rate for construction...Ch. 20.5 - Shipments of product from manufacturer to the...Ch. 20.5 - The revenue for Google for the years 2010-2014 is...Ch. 20.7 - Data on quantities of three items sold in Year 1...Ch. 20.7 - Prob. 15ECh. 20.7 - Prob. 16ECh. 20 - Many factors influence the retail price of...Ch. 20 - Nickerson Manufacturing Company has the following...Ch. 20 - Prob. 19ECh. 20 - Prob. 20ECh. 20 - Prob. 21ECh. 20 - Prob. 22ECh. 20 - Seafood price and quantity data are reported by...Ch. 20 - Prob. 24ECh. 20 - Prob. 25ECh. 20 - Prob. 26E
Knowledge Booster


Learn more about
Need a deep-dive on the concept behind this application? Look no further. Learn more about this topic, statistics and related others by exploring similar questions and additional content below.Similar questions
- Molly O'Malley is the new manager of the materials storeroom for Tudor Manufacturing. Mollly has been asked to estimate future monthly purchase costs for part #696, used in two of Tudor's products. Molly has purchase cost and quantity data for the past 9 months as follows: Month Cost of Purchase Quantity Purchased January $12,410 2,650 parts February 12,770 2,850 March 17,403 4,116 April 15,838 3,761 May 13,249 2,901 June 14,022 3,376 July 15,237 3,644 August 10,087 2,287 September 14,900 3,592 Estimated monthly purchases for this part based on expected demand of the two products for the rest of the year are as follows: Month Purchase Quantity Expected October 3,350 parts November 3,770 December 3,050 The computer in Molly's office is down, and Molly has been asked to immediately provide an equation to estimate the future purchase cost for part #696. Molly grabs a calculator and uses the high-low method to estimate a cost equation. What…arrow_forwardHere are selected entries from the 2010 tax table that show the federal income tax owed by those married and filing jointly. The taxable income and the tax are both in dollars. Taxable income Tax 67,500 9291 67,600 9306 67,700 9321 67,800 9336 67,900 9351 68,000 9369 68,100 9394 68,200 9419 68,300 9444 68,400 9469 68,500 9494 68,600 9519 Over what two parts of this table is the tax T a linear function of the taxable income t? 67,500 ≤ t ≤ 68,200 and 68,300 ≤ t ≤ 68,600 67,500 ≤ t ≤ 68,100 and 68,200 ≤ t ≤ 68,600 67,500 ≤ t ≤ 68,000 and 68,100 ≤ t ≤ 68,600 67,500 ≤ t ≤ 67,900 and 68,000 ≤ t ≤ 68,600 67,500 ≤ t ≤ 67,700 and 67,800 ≤ t ≤ 68,600 Find formulas for both linear functions. (Let T be tax and t taxable income.) lower range T = 320t+58294 upper range T = Explain in practical terms what the slopes meanarrow_forwardFollowing are the quantities and prices for the years 2010 and 2018 for Kinzua Valley Geriatrics. Use 2010 as the base period. 2010 2018ItemPriceQuantity PriceQuantitySyringes (dozen)$6.94 1,332 $6.18 1,957 Thermometers 8.32 5 16.38 15 Advil (bottle) 4.69 283 8.89 295 Patient record forms (box) 6.19 924 9.82 1,027 Copier paper (box) 10.48 55 25.96 81 %media:2excel.ext% Click here for the Excel Data File a. Determine the simple price indexes. (Round your answers to 2 decimal places.) b. Determine the simple aggregate price index for the two years. (Round your answer to 2 decimal places.) c. Determine the Laspeyres price index. (Round your answer to 2 decimal places.) d. Determine the Paasche price index. (Round your answer to 2 decimal places.) e. Determine Fisher's ideal index. (Round your answer to 2 decimal places.).arrow_forward
- For every one unit increase in horsepower, how much would the predicted price value of a car would be? PRICE (in thousands) HORSEPOWER 1 42 210 2 23.99 150 3 33.95 200 4 62 310 5 26.99 170 6 33.4 193 7 38.9 193 8 21.975 175 9 25.3 240 10 31.965 205 11 27.885 205 12 39.895 275 13 44.475 275 14 39.665 275 15 31.01 200 16 46.225 255 17 13.26 115 18 16.535 170 19 18.89 175 20 19.39 180 21 24.34 200 22 45.705 345 23 13.96 120 24 9.235 55 25 18.89 180 26 19.84 163 27 24.495 168 28 22.245 200 29 16.48 132 30 28.34 253 Using SPSS Give the following: Null hypothesis Alternative hypothesis Statistical test Computation Decision Conclusionarrow_forwardA municipal solid-waste site for a city must be located at Site A or Site B. After sorting, some of the solid refuse will be transported to an electric powerplant where it will be used as fuel. Data for the hauling of refuse from each site to the power plant are shown in Table P2-4. If the power plant will pay $8.00 per cubic yard of sorted solid waste delivered to the plant, where should the solid-waste site be located? Use the city’s viewpoint and assume that 200,000 cubic yards of refuse will be hauled to the plant for one year only. One site must be selected.arrow_forwardThe table below contains monthly share prices for Pfizer Inc. (PFE) and Astrazeneca Plc. (AZN). It also contains the monthly prices for the S&P 5000 index (S&PCOMP). Date Time S&PCOMP PFE AZN 2/1/2019 0 2510.03 43.25 37.80 1/2/2019 1 2706.53 42.88 36.65 1/3/2019 2 2803.69 43.36 41.76 1/4/2019 3 2867.19 42.84 41.27 1/5/2019 4 2923.73 40.77 37.35 3/6/2019 5 2744.45 41.92 37.90 1/7/2019 6 2964.33 43.77 41.31 1/8/2019 7 2953.56 38.25 44.00 3/9/2019 8 2906.27 36.12 45.27 1/10/2019 9 2940.25 35.43 43.66 1/11/2019 10 3066.91 38.39 48.39 2/12/2019 11 3113.87 38.29 48.38 2/1/2020 12 3257.85 39.14 50.39 3/2/2020 13 3248.92 37.51 48.51 2/3/2020 14 3090.23 34.88 45.87 1/4/2020 15 2470.50 31.75 43.78 1/5/2020 16 2830.71 37.64 51.86 1/6/2020 17 3055.73 35.46 55.16 1/7/2020 18 3115.86 33.74 53.32 3/8/2020 19 3294.61 38.35 56.82 1/9/2020 20 3526.65 36.88 55.38 1/10/2020 21 3380.80 36.37 54.30 2/11/2020 22 3310.24 36.23 50.62 1/12/2020 23…arrow_forward
- Rank Player Money ($) Scoring Average DrDist DrAccu GIR 1 Vijay Singh 6,601,094 70.27 297.8 59.45 68.45 2 Phil Mickelson 5,188,875 70.28 295.7 55.27 65.81 3 Sergio Garcia 4,858,224 70.6 294.6 59.39 67.06 4 Kenny Perry 4,663,794 70.21 296 61.97 67.47 5 Anthony Kim 4,656,265 70.22 300.9 58.34 65.78 6 Camilo Villegas 4,422,641 70.6 293.3 58.15 64.6 7 Padraig Harrington 4,313,551 70.7 296.3 59.37 60.67 8 Stewart Cink 3,979,301 70.65 296.9 55.27 66.94 9 Justin Leonard 3,943,542 70.41 281.4 67.72 66.61 10 Robert Allenby 3,606,700 70.64 291.7 65.64 70.4 11 Jim Furyk 3,455,714 70.56 280.4 69.37 66.78 12 Ryuji Imada 3,029,363 71.13 278.6 59.64 61.39 13 Mike Weir 3,020,135 70.68 284.8 62.46 64.62 14 Geoff Ogilvy 2,880,099 71.38 292.1 58.18 61.89 15 K.J. Choi 2,683,442 71.01 286.1 61.38 65.48 16 Ben Curtis 2,615,798 70.96 284.7 67.2 63.45 17 Kevin Sutherland 2,581,311 70.22 291 61.93 68.2 18 Trevor Immelman 2,566,199 71.85 291.3 62.45 63.07 19 Ernie Els…arrow_forwardThe Ashland MultiComm Services (AMS) marketing department wants to increase subscriptions for its 3-For-All telephone, cable, and Internet combined service. To ensure that as many trial subscriptions to the 3-For-All service as possible are converted to regular subscriptions, the marketing department works closely with the customer support department to accomplish a smooth initial process for the trial subscription customers. To assist in this effort, the marketing department needs to accurately forecast the monthly total of new regular subscriptions. A team consisting of managers from the marketing and customer support departments was convened to develop a better method of forecasting new subscriptions. Previously, after examining new subscription data for the prior three months, a group of three managers would develop a subjective forecast of the number of new subscriptions. Livia Salvador, who was recently hired by the company to provide expertise in quantitative forecasting…arrow_forwardRighetti Homes, a custom home builder in Arizona, is currently offering three models in a newly developed residential neighborhood in Scottsdale. The accompanying Specs worksheet includes the information about the three models, including selling prices, material costs, labor costs, buyer incentives (percent of the selling price), and average buyer upgrades (percent of the selling price). Righetti Homes plans to build 50 homes in the neighborhood, and it would like to estimate its total sales and profits in the new residential neighborhood. Model A Model B Model C Selling Price 399,990 499,990 649,990 Material Costs 120,000 150,000 200,000 Labor Costs 150,000 200,000 330,000 Buyer Incentives (percent of the selling price) 3% 5% 6% Average Buyer Upgrades (percent of the selling price) 12% 10% 8% 1. Build a spreadsheet model to help Righetti Homes estimate its total sales and profits in the new residential neighborhood. If Righetti Homes builds 10 Model A homes, what are…arrow_forward
- ITEM 2020-unit price (p0) 2020 quantity(q0) 2021-unit price(p1) 2021 quantity (q1) p0q0 p1q1 MINERAL SPIRITS 17.7 30 20.7 45 531 531 10mm spanner 37 60 49 50 2220 2450 25mm brush 42 30 48 40 1260 1920 Total 4011 5301.50 Using 2020 as the base year, compute the Paasche price index for all of theitems for 2021. Interpret your answerarrow_forwardThe following table presents the manufacturer’s suggested retail price (in $1000s) for base models and styles of BMW automobiles. 35.3 37.3 41.1 43.1 40.0 45.0 47.0 53.1 55.1 46.8 51.4 53.4 57.7 64.0 51.2 53.2 86.5 89.5 95.6 102.7 58.9 54.8 47.8 50.4 52.4 54.0 56.0 69.2 77.7 103.1 137.7 69.9 76.9 73.4 80.4 63.5 a. Construct (fill out) a frequency distribution using 5 classes that have a class width of 21. Begin with a lower limit of 35. Include the classes, boundaries or midpoints, frequency, and relative frequency. Class Frequency Relative Frequency Boundaries or midpoints (your choice) b. Draw a frequency or relative frequency histogram. Completely label your axis and place a title on your graph.arrow_forwardIn January 2019, daily sales in pesos of Triple A and V enterprises, for the first 10 days are as follows. Php 3,286.20, Php 2,831.50, Php 6,280.00, Php 526.50, Php 5,867.30, Php 4, 345.00, Php 5, 261.00, Php 4,265.50, Php 7,820.00, Php 4,625.00, Php 8,625.00, Php 2,348.50. Find the following: d. 5th decile e. 25th percentile f. 50th percentilearrow_forward
arrow_back_ios
SEE MORE QUESTIONS
arrow_forward_ios
Recommended textbooks for you
 MATLAB: An Introduction with ApplicationsStatisticsISBN:9781119256830Author:Amos GilatPublisher:John Wiley & Sons Inc
 Probability and Statistics for Engineering and th...StatisticsISBN:9781305251809Author:Jay L. DevorePublisher:Cengage Learning
 Statistics for The Behavioral Sciences (MindTap C...StatisticsISBN:9781305504912Author:Frederick J Gravetter, Larry B. WallnauPublisher:Cengage Learning
 Elementary Statistics: Picturing the World (7th E...StatisticsISBN:9780134683416Author:Ron Larson, Betsy FarberPublisher:PEARSON
 The Basic Practice of StatisticsStatisticsISBN:9781319042578Author:David S. Moore, William I. Notz, Michael A. FlignerPublisher:W. H. Freeman
 Introduction to the Practice of StatisticsStatisticsISBN:9781319013387Author:David S. Moore, George P. McCabe, Bruce A. CraigPublisher:W. H. Freeman
MATLAB: An Introduction with Applications
Statistics
ISBN:9781119256830
Author:Amos Gilat
Publisher:John Wiley & Sons Inc
Probability and Statistics for Engineering and th...
Statistics
ISBN:9781305251809
Author:Jay L. Devore
Publisher:Cengage Learning
Statistics for The Behavioral Sciences (MindTap C...
Statistics
ISBN:9781305504912
Author:Frederick J Gravetter, Larry B. Wallnau
Publisher:Cengage Learning
Elementary Statistics: Picturing the World (7th E...
Statistics
ISBN:9780134683416
Author:Ron Larson, Betsy Farber
Publisher:PEARSON
The Basic Practice of Statistics
Statistics
ISBN:9781319042578
Author:David S. Moore, William I. Notz, Michael A. Fligner
Publisher:W. H. Freeman
Introduction to the Practice of Statistics
Statistics
ISBN:9781319013387
Author:David S. Moore, George P. McCabe, Bruce A. Craig
Publisher:W. H. Freeman
Correlation Vs Regression: Difference Between them with definition & Comparison Chart; Author: Key Differences;https://www.youtube.com/watch?v=Ou2QGSJVd0U;License: Standard YouTube License, CC-BY
Correlation and Regression: Concepts with Illustrative examples; Author: LEARN & APPLY : Lean and Six Sigma;https://www.youtube.com/watch?v=xTpHD5WLuoA;License: Standard YouTube License, CC-BY