
Modern Business Statistics with Microsoft Office Excel (with XLSTAT Education Edition Printed Access Card) (MindTap Course List)
6th Edition
ISBN: 9781337115186
Author: David R. Anderson, Dennis J. Sweeney, Thomas A. Williams, Jeffrey D. Camm, James J. Cochran
Publisher: Cengage Learning
expand_more
expand_more
format_list_bulleted
Concept explainers
Videos
Textbook Question
Chapter 20.2, Problem 3E
Hudson Corporation is considering three options for managing its data processing operation: continue with its own staff, hire an outside vendor to do the managing (referred to as outsourcing), or use a combination of its own staff and an outside vendor. The cost of the operation depends on future demand. The annual cost of each option (in thousands of dollars) depends on demand as follows:
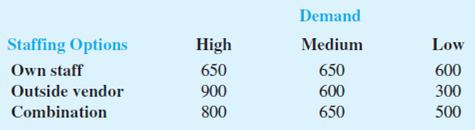
- a. If the demand probabilities are .2, .5, and .3, which decision alternative will minimize the expected cost of the data processing operation? What is the expected annual cost associated with your recommendation?
- b. What is the
expected value of perfect information?
Expert Solution & Answer
Want to see the full answer?
Check out a sample textbook solution
Students have asked these similar questions
Hudson Corporation is considering three options for managing its data processing operation: continue with its own staff, hire an outside vendor to do the managing (referred to as outsourcing), or use a combination of its own staff and an outside vendor. The cost of the operation depends on future demand. The annual cost of each option (in thousands of dollars) depends on demand as follows:
a. If the demand probabilities are .2, .5,and .3, which decision alternative will minimize the expected cost of the data processing operation? What is the expected annual cost associated with your recommendation?
b. What is the expected value of perfect information?
First Securities, Inc., an investment firm, has $380,000 on account. The chief investment officer would like to reinvest the $380,000 in a portfolio that would maximize return on investment while at the same time maintaining a relatively conservative mix of stocks and bonds. The following table shows the investment opportunities and rates of return.
Investment Opportunity
Rate of Return
Municipal Bonds (X1)
0.095
High Tech Stock (X2)
0.146
Blue Chip Stock (X3)
0.075
Federal Bonds (X4)
0.070
a) The Board of Directors has mandated that at least 60 percent of the investment consist of a combination of municipal and federal bonds, at least 25 percent Blue Chip Stock, no more than 30 percent High Tech and Blue Chip Stock, and no more than 15 percent High Tech Stock.
Based on above problem, how many constraints are in this problem?
A) 3
B) 4
C) 5
D) 2
b) Based on part a, which of the…
XYZ Manufaturing company has hired a new VP (D.A.King) for managing capacity investment decisions. Mr. King reviews the situation after he comes on board and decides that he can invest in Batch manufacturing, Custom manufacturing or Group technology. Mr. King will not be able to forecast demand accurately till after the technology choices are made. Demand will be classified into four scenarios: poor, fair, good and excellent. The table below indicates the payoffs for each combination of technology choice and demand scenario.
POOR
FAIR
GOOD
EXCELLENT
PROBABILITY
0.1
0.4
0.3
0.2
Batch
- $200,000
$1,000,000
$1,200,000
$1,300,000
Custom
$100,000
$300,000
$700,000
$800,000
Group Technology
- $1,000,000
-$500,000
$500,000
$2,000,000
1.What is the expected monetary value of choosing the Group Technology option?
2.What is the expected monetary value of choosing the Batchoption?
3What is the BEST decision based on…
Chapter 20 Solutions
Modern Business Statistics with Microsoft Office Excel (with XLSTAT Education Edition Printed Access Card) (MindTap Course List)
Ch. 20.2 - Prob. 1ECh. 20.2 - Prob. 2ECh. 20.2 - 3. Hudson Corporation is considering three options...Ch. 20.2 - 4. Myrtle Air Express decided to offer direct...Ch. 20.2 - 5. The distance from Potsdam to larger markets and...Ch. 20.2 - 6. Seneca Hill Winery recently purchased land for...Ch. 20.2 - 7. The Lake Placid Town Council has decided to...Ch. 20.3 - Consider a variation of the PDC decision tree...Ch. 20.3 - 9. A real estate investor has the opportunity to...Ch. 20.3 - Dante Development Corporation is considering...
Ch. 20.3 - 11. Hale’s TV Productions is considering producing...Ch. 20.3 - 12. Martin’s Service Station is considering...Ch. 20.3 - 13. Lawson’s Department Store faces a buying...Ch. 20.4 - Prob. 14ECh. 20.4 - 15. In the following profit payoff table for a...Ch. 20.4 - 16. To save on expenses, Rona and Jerry agreed to...Ch. 20.4 - 17. The Gorman Manufacturing Company must decide...Ch. 20 - Prob. 18SECh. 20 - 19. Warren Lloyd is interested in leasing a new...Ch. 20 - Hemmingway, Inc., is considering a $50 million...Ch. 20 - 21. Embassy Publishing Company received a...Ch. 20 - Case Problem Lawsuit Defense Strategy
John...
Knowledge Booster


Learn more about
Need a deep-dive on the concept behind this application? Look no further. Learn more about this topic, statistics and related others by exploring similar questions and additional content below.Similar questions
- Nicholas Grammas is an investment analyst examining the performance of two mutual funds with Janus Capital Group: the Janus Balanced Fund and the Janus Overseas Fund. The Janus Balanced Fund (JANBX): This “core” fund consists of stocks and bonds and its goal is diversification. It has historically produced solid long-term returns through different market cycles. The Janus Overseas Fund (JAOSX): This fund invests in overseas companies based on their individual merits instead of their geography or industry sector. The following table reports a portion of the annual returns (in percent) for these two funds from 2000–2016. Year. Balanced. Overseas 2000 -2.16 -18.57 2001 -5.04 -23.11 2002 -6.56 -23.89 2003 13.74 36.79 2004 8.71 18.58 2005 7.75 32.39 2006 10.56 47.21 2007 10.15 27.76 2008 -15.22 -52.75 2009 24.28 78.12 2010 7.83 19.28…arrow_forwardA machine shop owner is thinking of expanding his operations. He has 3 options: a drill press, a lathe, and a grinder. The return on investment for each tool is largely determined by whether the company wins a government military contract. The profit and loss for each purchase and the probabilities associated with each contract outcome are shown in the payoff table below: Purchase Contract 0.40 No Contract 0.60 Drill Press $40,000 ($8,000) Lathe $20,000 $4,000 Grinder $12,000 $10,000 Part 1) Compute for the expected value of each alternative and select the best option.arrow_forward1. Expenses for Joey's college attendance next year are as follows (in $): Tuition = 8400 Dormitory = 5400 Meals ~Unif(900,1350) Entertainment ~Unif(600,1200) Transportation ~Unif(200,600) Books ~Unif(400,800) Here are the income streams the student has for next year: Scholarship = 3000 Parents = 4000 Waiting Tables ~Unif(3000,5000) Library Job ~Unif(2000,3000) Use Monte Carlo simulation to estimate the expected value of the loan that will be needed to enable Joey to go to college next year.arrow_forward
- General Buck Turgidson is preparing to make his annual budget presentation to the U.S. Senate and is speculating about his chances of getting all or part of his requested budget approved. From his 20 years of experience in making these requests, he has deduced that his chances of getting between 50 and 74 percent of his budget approved are twice as good as those of getting between 75 and 99 percent approved, and two and one-half times as good as those of getting between 25 and 49 percent approved. Further, the general believes that there is no chance of less than 25 percent of his budget being approved. Finally, the entire budget has been approved only once during the general’s tenure, and the general does not expect this pattern to change. What are the probabilities of 0–24 percent, 25–49 percent, 50–74 percent, 75–99 percent, and 100 percent approval, according to the general?arrow_forwardConsider the following payoff matrix.arrow_forwardHow common are financial cost or contractual constraints associated with smartphone ownership? A survey of smartphone users found that 48% of the 18- to29-year-olds, 39% of the 30- to 49-year-olds, 24% of the 50- to 64-year-olds, and 19% of those aged 65 or older have reached the maximum amount of data they are allowed to use as part of their plan, at least on occasion: Suppose the survey was based on 300 smartphone owners in each of the four age groups: 18 to 29, 30 to 49, 50 to 64, and 65 and older. Complete parts (a) through (c). a. At the 0.05 level of significance, is there evidence of a difference among the age groups in the proportion of smartphone owners who have reached the maximum amount of data they are allowed to use as part of their plan, at least on occasion? The test statistic is χ2STAT= (Round to three decimal places as needed.) I am struggling in finding the expected frequency can you show in detail how you accomplish this for each…arrow_forward
- According to a study administered by the National Bureau of Economic Research, half of Americans would struggle to come up with $2000 in the event of a financial emergency. The majority of the 1900 Americans surveyed said they would rely on more than one method to come up with emergency funds if required. In the survey, 397 people said that they "certainly" would not be able to cope with an unexpected $2000 bill if they had to come up with the money in 30 days, and 553 people said they "probably" would not be able to cope. Step 1 of 2 : What percentage of Americans "certainly" would not be able to produce $2000 in the event of an emergency according to the study? Round your answer to one decimal place, if necessary.arrow_forwardHow common are financial cost or contractual constraints associated with smartphone ownership? A survey of smartphone users found that 48% of the 18- to 29-year-olds, 39% of the 30- to 49-year-olds, 24% of the 50- to 64-year-olds, and 19% of those age 65 or older have reached the maximum amount of data they are allowed to use as part of their plan, at least on occasion: Suppose the survey was based on 300 smartphone owners in each of the four age groups: 18 to 29, 30 to 49, 50 to 64, and 65 and older. Complete parts (a) through (c). a. At the 0.05 level of significance, is there evidence of a difference among the age groups in the proportion of smartphone owners who have reached the maximum amount of data they are allowed to use as part of their plan, at least on occasion? Find the test statistic x 2 stat? and critcal valuearrow_forwardHow common are financial cost or contractual constraints associated with smartphone ownership? A survey of smartphone users found that 49% of the 18- to 29-year-olds, 40% of the 30- to 49-year-olds, 25% of the 50- to 64-year-olds, and 19% of those age 65 or older have reached the maximum amount of data they are allowed to use as part of their plan, at least on occasion: Suppose the survey was based on 200 smartphone owners in each of the four age groups: 18 to 29, 30 to 49, 50 to 64, and 65 and older The critical value for this test is ? (round to three decimal points as needed)arrow_forward
- How common are financial cost or contractual constraints associated with smartphone ownership? A survey of smartphone users found that 49% of the 18- to 29-year-olds, 40% of the 30- to 49-year-olds, 25% of the 50- to 64-year-olds, and 19% of those age 65 or older have reached the maximum amount of data they are allowed to use as part of their plan, at least on occasion: Suppose the survey was based on 200 smartphone owners in each of the four age groups: 18 to 29, 30 to 49, 50 to 64, and 65 and older What is the p-value?arrow_forwardHow common are financial cost or contractual constraints associated with smartphone ownership? A survey of smartphone users found that 49% of the 18- to 29-year-olds, 40% of the 30- to 49-year-olds, 25% of the 50- to 64-year-olds, and 19% of those age 65 or older have reached the maximum amount of data they are allowed to use as part of their plan, at least on occasion: Suppose the survey was based on 200 smartphone owners in each of the four age groups: 18 to 29, 30 to 49, 50 to 64, and 65 and older The test statistic is χ2STAT = ? (Round to three decimial places)arrow_forwardHow common are financial cost or contractual constraints associated with smartphone ownership? A survey of smartphone owners found that 48% of the 18- to 29-year-olds, 38% of the 30- to 49-year-olds, 25% of the 50- to 64-year-olds, and 19% of those age 65 or older have reached the maximum amount of data they are allowed to use as part of their plan, at least on occasion. Suppose the survey was based on 200 smartphone owners in each of the four age groups: 18 to 29, 30 to 49, 50 to 64, and 65+. a. At the 0.05 level of significance, is there evidence of a differ-ence among the age groups in the proportion of smartphone owners who have reached the maximum amount of data they are allowed to use as part of their plan, at least on occasion? b. Determine the p-value in (a) and interpret its meaning. c. If appropriate, use the Marascuilo procedure and a=0.05 to determine which age groups differ.arrow_forward
arrow_back_ios
SEE MORE QUESTIONS
arrow_forward_ios
Recommended textbooks for you
 MATLAB: An Introduction with ApplicationsStatisticsISBN:9781119256830Author:Amos GilatPublisher:John Wiley & Sons Inc
 Probability and Statistics for Engineering and th...StatisticsISBN:9781305251809Author:Jay L. DevorePublisher:Cengage Learning
 Statistics for The Behavioral Sciences (MindTap C...StatisticsISBN:9781305504912Author:Frederick J Gravetter, Larry B. WallnauPublisher:Cengage Learning
 Elementary Statistics: Picturing the World (7th E...StatisticsISBN:9780134683416Author:Ron Larson, Betsy FarberPublisher:PEARSON
 The Basic Practice of StatisticsStatisticsISBN:9781319042578Author:David S. Moore, William I. Notz, Michael A. FlignerPublisher:W. H. Freeman
 Introduction to the Practice of StatisticsStatisticsISBN:9781319013387Author:David S. Moore, George P. McCabe, Bruce A. CraigPublisher:W. H. Freeman
MATLAB: An Introduction with Applications
Statistics
ISBN:9781119256830
Author:Amos Gilat
Publisher:John Wiley & Sons Inc
Probability and Statistics for Engineering and th...
Statistics
ISBN:9781305251809
Author:Jay L. Devore
Publisher:Cengage Learning
Statistics for The Behavioral Sciences (MindTap C...
Statistics
ISBN:9781305504912
Author:Frederick J Gravetter, Larry B. Wallnau
Publisher:Cengage Learning
Elementary Statistics: Picturing the World (7th E...
Statistics
ISBN:9780134683416
Author:Ron Larson, Betsy Farber
Publisher:PEARSON
The Basic Practice of Statistics
Statistics
ISBN:9781319042578
Author:David S. Moore, William I. Notz, Michael A. Fligner
Publisher:W. H. Freeman
Introduction to the Practice of Statistics
Statistics
ISBN:9781319013387
Author:David S. Moore, George P. McCabe, Bruce A. Craig
Publisher:W. H. Freeman
Mod-01 Lec-01 Discrete probability distributions (Part 1); Author: nptelhrd;https://www.youtube.com/watch?v=6x1pL9Yov1k;License: Standard YouTube License, CC-BY
Discrete Probability Distributions; Author: Learn Something;https://www.youtube.com/watch?v=m9U4UelWLFs;License: Standard YouTube License, CC-BY
Probability Distribution Functions (PMF, PDF, CDF); Author: zedstatistics;https://www.youtube.com/watch?v=YXLVjCKVP7U;License: Standard YouTube License, CC-BY
Discrete Distributions: Binomial, Poisson and Hypergeometric | Statistics for Data Science; Author: Dr. Bharatendra Rai;https://www.youtube.com/watch?v=lHhyy4JMigg;License: Standard Youtube License