
Concept explainers
Videos
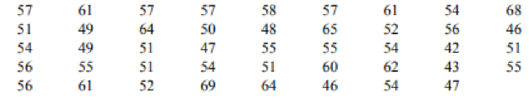
Ages of Presidents at Inauguration
The data represent the ages of our Presidents at the time they were first inaugurated.
1. Were the data obtained from a population or a sample? Explain your answer.
2. What was the age of the oldest President?
3. What was the age of the youngest President?
4. Construct a frequency distribution for the data. (Use your own judgment as to the number of classes and class size.)
5. Are there any peaks in the distribution?
6. Identify any possible outliers.
7. Write a brief summary of the nature of the data as shown in the frequency distribution.
(1)
To explain: Whether the given data is obtained from a population or a sample.
Answer to Problem 1AC
The given data is obtained from a population.
Explanation of Solution
Given info:
The below data shows the ages of our presidents at time they were first inaugurated.
| 57 | 61 | 57 | 57 | 58 | 57 | 61 | 54 | 68 |
| 51 | 49 | 64 | 50 | 48 | 65 | 52 | 56 | 46 |
| 54 | 49 | 51 | 47 | 55 | 55 | 54 | 42 | 51 |
| 56 | 55 | 51 | 54 | 51 | 60 | 62 | 43 | 55 |
| 56 | 61 | 52 | 69 | 64 | 46 | 54 | 47 |
Justification:
The population is the universal set under study and the sample is the small subset of the population.
Since, the data represent the ages of all the presidents at the time they were first inaugurate; therefore all the presidents are included under study.
Therefore, the given data is obtained from a population.
(2)
The age of the oldest president.
Answer to Problem 1AC
The age of the oldest president is 69 years.
Explanation of Solution
Given info:
The below data shows the ages of our presidents at time they were first inaugurated.
| 57 | 61 | 57 | 57 | 58 | 57 | 61 | 54 | 68 |
| 51 | 49 | 64 | 50 | 48 | 65 | 52 | 56 | 46 |
| 54 | 49 | 51 | 47 | 55 | 55 | 54 | 42 | 51 |
| 56 | 55 | 51 | 54 | 51 | 60 | 62 | 43 | 55 |
| 56 | 61 | 52 | 69 | 64 | 46 | 54 | 47 |
Calculation:
The given data represents the ages of our presidents at time they were first inaugurated. The maximum number in the given data represents the age of oldest president and the minimum number in the given data represents the age of the youngest president.
From the given data it is noticed that the maximum number in the data is 69, it means the age of the present is 69 years at time he was first inaugurated.
Therefore, the age of the oldest president is 69 years.
(3)
The age of the youngest president.
Answer to Problem 1AC
The age of the youngest president is 42 years.
Explanation of Solution
Given info:
The below data shows the ages of our presidents at time they were first inaugurated.
| 57 | 61 | 57 | 57 | 58 | 57 | 61 | 54 | 68 |
| 51 | 49 | 64 | 50 | 48 | 65 | 52 | 56 | 46 |
| 54 | 49 | 51 | 47 | 55 | 55 | 54 | 42 | 51 |
| 56 | 55 | 51 | 54 | 51 | 60 | 62 | 43 | 55 |
| 56 | 61 | 52 | 69 | 64 | 46 | 54 | 47 |
Calculation:
The given data represents the ages of our presidents at time they were first inaugurated. The maximum number in the given data represents the age of oldest president and the minimum number in the given data represents the age of the youngest president.
From the given data it is noticed that the minimum number in the data is 42, it means the age of the present is 42 years at time he was first inaugurated
Therefore, the age of the youngest president is 42 years.
(4)
A frequency distribution for the given data.
Answer to Problem 1AC
The frequency distribution with 7 classes is given in following table:
| Class limits | Frequency |
| 42-45 | 2 |
| 46-49 | 7 |
| 50-53 | 8 |
| 54-57 | 16 |
| 58-61 | 5 |
| 62-65 | 4 |
| 66-69 | 2 |
Explanation of Solution
Given info:
The below shows the ages of our presidents at time they were first inaugurated.
| 57 | 61 | 57 | 57 | 58 | 57 | 61 | 54 | 68 |
| 51 | 49 | 64 | 50 | 48 | 65 | 52 | 56 | 46 |
| 54 | 49 | 51 | 47 | 55 | 55 | 54 | 42 | 51 |
| 56 | 55 | 51 | 54 | 51 | 60 | 62 | 43 | 55 |
| 56 | 61 | 52 | 69 | 64 | 46 | 54 | 47 |
Calculation:
Assume that the number of classes for the frequency distribution is 7. The answer will vary according to the number of classes.
The highest value is 69 and the lowest value is 42.
The range is the difference of highest value and the lowest value.
The range is 27.
The class width is the ratio of range and classes.
The class width is 4.
Add the width to the smallest term of the data to get the lower limit of the next class and add up to 7 classes.
So the lower limits of all the 7 classes are, 42,46,50,54,58,62,66.
Subtract 1 from the lower limit of the second class to get the upper limit of the first class, then add the width to each upper limit in every class to get all the upper limits.
The first class is 42-45, the second class is 46-49, the third class is 50-53, the fourth class is 54-57, the fifth class is 58-61, the sixth class is 62-65 and the seventh class is 66-69.
To find the class boundaries, subtract 0.5 from each lower class limit and add 0.5 to each upper class limit.
Tally the data and find the numerical frequencies from the tallies.
The frequency distribution is given below:
| Class limits | Class boundaries | Tally | Frequency |
| 42-45 | 41.5 - 45.5 |
|
2 |
| 46-49 | 45.5 - 49.5 |
|
7 |
| 50-53 | 49.5 - 53.5 |
|
8 |
| 54-57 | 53.5 - 57.5 |
|
16 |
| 58-61 | 57.5 - 61.5 |
|
5 |
| 62-65 | 61.5 - 65.5 |
|
4 |
| 66-69 | 65.5 - 69.5 |
|
2 |
Therefore, the above table shows the frequency distribution for the given data.
(5)
The peak in the distribution.
Answer to Problem 1AC
The peak for the frequency distribution is 16 for the class
Explanation of Solution
Given info:
The below shows the ages of our presidents at time they were first inaugurated.
| 57 | 61 | 57 | 57 | 58 | 57 | 61 | 54 | 68 |
| 51 | 49 | 64 | 50 | 48 | 65 | 52 | 56 | 46 |
| 54 | 49 | 51 | 47 | 55 | 55 | 54 | 42 | 51 |
| 56 | 55 | 51 | 54 | 51 | 60 | 62 | 43 | 55 |
| 56 | 61 | 52 | 69 | 64 | 46 | 54 | 47 |
Calculation:
From part (4), the frequency distribution for the given data is shown below,
| Class limits | Frequency |
| 42-45 | 2 |
| 46-49 | 7 |
| 50-53 | 8 |
| 54-57 | 16 |
| 58-61 | 5 |
| 62-65 | 4 |
| 66-69 | 2 |
From the above table, it is clearly noticed that the highest frequency is 16 for the class
Therefore, the peak for the frequency distribution is 16 for the class
(6)
The possible outliers for the frequency distribution of the given data.
Answer to Problem 1AC
The frequency distribution of the given data has no outliers.
Explanation of Solution
Given info:
The below shows the ages of our presidents at time they were first inaugurated.
| 57 | 61 | 57 | 57 | 58 | 57 | 61 | 54 | 68 |
| 51 | 49 | 64 | 50 | 48 | 65 | 52 | 56 | 46 |
| 54 | 49 | 51 | 47 | 55 | 55 | 54 | 42 | 51 |
| 56 | 55 | 51 | 54 | 51 | 60 | 62 | 43 | 55 |
| 56 | 61 | 52 | 69 | 64 | 46 | 54 | 47 |
Calculation:
Sort the given data in increasing order.
| 42 | 50 | 54 | 56 | 61 |
| 43 | 51 | 54 | 56 | 61 |
| 46 | 51 | 54 | 57 | 62 |
| 46 | 51 | 54 | 57 | 64 |
| 47 | 51 | 55 | 57 | 64 |
| 47 | 51 | 55 | 57 | 65 |
| 48 | 52 | 55 | 58 | 68 |
| 49 | 52 | 55 | 60 | 69 |
| 49 | 54 | 56 | 61 |
The total terms are 44, the value of n is 44 which is an even number.
Formula for first quartile is,
Substitute
Formula for third quartile is,
Substitute
The value of first quartile is 51 and value of third quartile is 57.5.
Formula for inter quartile range is,
Multiply the above value by 1.5.
Subtract the above value from
Add the value 9.75 in
If any value lies outside the interval from 41.25 to 67.25, then it is consider as outliers.
The frequency distribution of part (4), shows that there is no outliers.
Therefore, the frequency distribution of the given data has no outliers.
(7)
To explain: The nature of the given data.
Answer to Problem 1AC
The given data appears to be fairly symmetric, with center on 55 years of age.
Explanation of Solution
The below shows the ages of our presidents at time they were first inaugurated.
| 57 | 61 | 57 | 57 | 58 | 57 | 61 | 54 | 68 |
| 51 | 49 | 64 | 50 | 48 | 65 | 52 | 56 | 46 |
| 54 | 49 | 51 | 47 | 55 | 55 | 54 | 42 | 51 |
| 56 | 55 | 51 | 54 | 51 | 60 | 62 | 43 | 55 |
| 56 | 61 | 52 | 69 | 64 | 46 | 54 | 47 |
From the above table, it is noticed that the date is fairly symmetric, centering on 55 and the graph of the given data is bell shaped.
Therefore, the given data appears to be fairly symmetric, with center on 55 years of age.
Want to see more full solutions like this?
Chapter 2 Solutions
Elementary Statistics: A Step By Step Approach
Additional Math Textbook Solutions
Introductory Statistics
An Introduction to Mathematical Statistics and Its Applications (6th Edition)
Introductory Statistics (10th Edition)
Basic Business Statistics, Student Value Edition


 Glencoe Algebra 1, Student Edition, 9780079039897...AlgebraISBN:9780079039897Author:CarterPublisher:McGraw Hill
 Big Ideas Math A Bridge To Success Algebra 1: Stu...AlgebraISBN:9781680331141Author:HOUGHTON MIFFLIN HARCOURTPublisher:Houghton Mifflin Harcourt