
Total income, net taxes and
Explanation of Solution
Figure 1 represents the circular flow of income in the economy. The information provided in the given case indicates that government expenditure in the economy, shown by 'U' in Figure 1, is $2 trillion. The variable 'W' that reflects consumption expenditure in the economy, is worth $7 trillion.
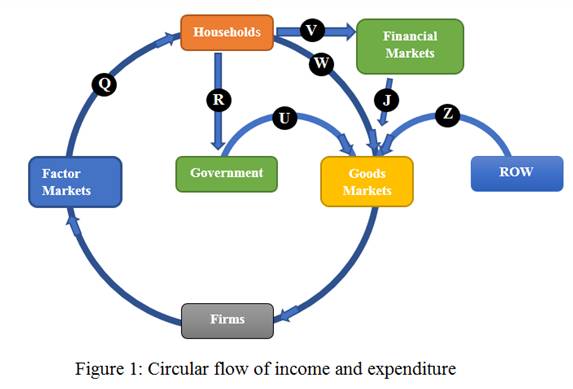
In the similar manner, the flow shown by variable 'J' is the investment expenditure and 'Z' shows the flow of net exports. These expenditures are equal to $1.5 trillion and $0 respectively.
In an economy, the total income is the factor income earned by the factors o9f production. Here, the factor market is paying an income shown by 'Q' in Figure 1. This value is not provided. Hence, use the
Under expenditure method, GDP is computed as the sum of four expenditures:

Here 'C' is the consumption spending, 'I' is the investment spending, 'G' is the spending incurred by the government and 'NX' is the net exports. Data indicates that the value of 'C' is $7 trillion, and that of 'I' is $1.5 trillion. Net exports are worth $0 and 'G' is $2 trillion.
Use the expenditure method to find GDP as well as total income:


Total income as well as GDP is both worth.  trillionNet taxes represent the amount of taxes paid by the household that are subjected to all the cash benefits received by them. In figure 1, this is represented by a flow of variable 'R'. Note that there is no value provide for net taxes. Hence, use the following expression for net taxes:

In this case, 'S' is the saving and is shown by 'V' in figure 1.
The value of 'V' is $1.5 trillion so that saving is $1.5 trillion. Given that 'C' is $7 trillion and 'Y' is found to be $10.5 trillion. Use these values to find net taxes:


Hence, net taxes are worth$2 trillion.
Concept Introduction:
Circular flow of income is a tool that is used to represents the flow of real and monetary variables among various sectors in the economy. The nation has four major market participants in the form of firms, households, financial institutions and the government. The flow of goods and services is in the opposite direction to the flow of money.
Want to see more full solutions like this?
Chapter 21 Solutions
Foundations of Economics, Student Value Edition Plus MyLab Economics with eText -- Access Card Package (8th Edition)

- Suppose a small economy has two income tax rates: 15% for all income up to $50,000 and 30% for any income earned above $50,000. Suppose that the economy has a Government Budget for this year (year 1) of $58,500, and a total of five individuals earning the following income: Amy $20,000, Betty $40,000, Charlie $60,000, Dimitry $80,000, Evelyn $100,000. In chapter 5 we saw that GDP can be calculated in two ways, via the expenditure approach or the income approach, and that when the income approach is used, there must be adjustments made to National Income, specifically adding the Consumption of Fixed Capital and a Statistical Discrepancy. For the sake of simplicity, let's imagine that National Income is equal to GDP, in other words the Fixed Capital and the Statistical Discrepancy are equal to zero. Assuming a Marginal Propensity to Save (MPS) of 20% or 0.20, use the Keynesian Multiplier to determine the additional amount of government spending required.arrow_forwardSuppose a small economy has two income tax rates: 15% for all income up to $50,000 and 30% for any income earned above $50,000. Suppose that the economy has a Government Budget for this year (year 1) of $58,500, and a total of five individuals earning the following income: Amy $20,000, Betty $40,000, Charlie $60,000, Dimitry $80,000, Evelyn $100,000. In chapter 5 we saw that GDP can be calculated in two ways, via the expenditure approach or the income approach, and that when the income approach is used, there must be adjustments made to National Income, specifically adding the Consumption of Fixed Capital and a Statistical Discrepancy. For the sake of simplicity, let's imagine that National Income is equal to GDP, in other words the Fixed Capital and the Statistical Discrepancy are equal to zero. 3. What percent of the Nation's Income does the Total Tax Revenue represent?arrow_forwardSuppose a small economy has two income tax rates: 15% for all income up to $50,000 and 30% for any income earned above $50,000. Suppose that the economy has a Government Budget for this year (year 1) of $58,500, and a total of five individuals earning the following income: Amy $20,000, Betty $40,000, Charlie $60,000, Dimitry $80,000, Evelyn $100,000. In chapter 5 we saw that GDP can be calculated in two ways, via the expenditure approach or the income approach, and that when the income approach is used, there must be adjustments made to National Income, specifically adding the Consumption of Fixed Capital and a Statistical Discrepancy. For the sake of simplicity, let's imagine that National Income is equal to GDP, in other words the Fixed Capital and the Statistical Discrepancy are equal to zero. 2. What is the small Nation's Income in year 1? 3.arrow_forward
- Suppose a small economy has two income tax rates: 15% for all income up to $50,000 and 30% for any income earned above $50,000. Suppose that the economy has a Government Budget for this year (year 1) of $58,500, and a total of five individuals earning the following income: Amy $20,000, Betty $40,000, Charlie $60,000, Dimitry $80,000, Evelyn $100,000. In chapter 5 we saw that GDP can be calculated in two ways, via the expenditure approach or the income approach, and that when the income approach is used, there must be adjustments made to National Income, specifically adding the Consumption of Fixed Capital and a Statistical Discrepancy. For the sake of simplicity, let's imagine that National Income is equal to GDP, in other words the Fixed Capital and the Statistical Discrepancy are equal to zero. 1. Calculate the Total Tax Revenues. a) what would be the total tax revenue paid by each of the five citizens? b) what is the total tax revenue for the small nation? 2. What is the small…arrow_forwardSuppose a small economy has two income tax rates: 15% for all income up to $50,000 and 30% for any income earned above $50,000. Suppose that the economy has a Government Budget for this year (year 1) of $58,500, and a total of five individuals earning the following income: Amy $20,000, Betty $40,000, Charlie $60,000, Dimitry $80,000, Evelyn $100,000. In chapter 5 we saw that GDP can be calculated in two ways, via the expenditure approach or the income approach, and that when the income approach is used, there must be adjustments made to National Income, specifically adding the Consumption of Fixed Capital and a Statistical Discrepancy. For the sake of simplicity, let's imagine that National Income is equal to GDP, in other words, the Fixed Capital and the Statistical Discrepancy are equal to zero. 7. In year 2, what percent of the Nation's Income does the Total Tax Revenue represent? 11. Assuming a Marginal Propensity to Save (MPS) of 20% or 0.20, use the Keynesian Multiplier to…arrow_forwardSuppose a small economy has two income tax rates: 15% for all income up to $50,000 and 30% for any income earned above $50,000. Suppose that the economy has a Government Budget for this year (year 1) of $58,500, and a total of five individuals earning the following income: Amy $20,000, Betty $40,000, Charlie $60,000, Dimitry $80,000, Evelyn $100,000. In chapter 5 we saw that GDP can be calculated in two ways, via the expenditure approach or the income approach, and that when the income approach is used, there must be adjustments made to National Income, specifically adding the Consumption of Fixed Capital and a Statistical Discrepancy. For the sake of simplicity, let's imagine that National Income is equal to GDP, in other words the Fixed Capital and the Statistical Discrepancy are equal to zero. 7. In year 2, what percent of the Nation's Income does the Total Tax Revenue represent? 8. Suppose that the Government Budget remained the same in year 2. Is the economy experiencing a…arrow_forward
- Suppose a small economy has two income tax rates: 15% for all income up to $50,000 and 30% for any income earned above $50,000. Suppose that the economy has a Government Budget for this year (year 1) of $58,500, and a total of five individuals earning the following income: Amy $20,000, Betty $40,000, Charlie $60,000, Dimitry $80,000, Evelyn $100,000. In chapter 5 we saw that GDP can be calculated in two ways, via the expenditure approach or the income approach, and that when the income approach is used, there must be adjustments made to National Income, specifically adding the Consumption of Fixed Capital and a Statistical Discrepancy. For the sake of simplicity, let's imagine that National Income is equal to GDP, in other words the Fixed Capital and the Statistical Discrepancy are equal to zero. Now assume that a recession (triggered by a reduction of Aggregate Demand) causes each of the five incomes to fall by 25%. In other words, income is 75% of what they used to be. Given the…arrow_forwardSuppose a small economy has two income tax rates: 15% for all income up to $50,000 and 30% for any income earned above $50,000. Suppose that the economy has a Government Budget for this year (year 1) of $58,500, and a total of five individuals earning the following income: Amy $20,000, Betty $40,000, Charlie $60,000, Dimitry $80,000, Evelyn $100,000. In chapter 5 we saw that GDP can be calculated in two ways, via the expenditure approach or the income approach, and that when the income approach is used, there must be adjustments made to National Income, specifically adding the Consumption of Fixed Capital and a Statistical Discrepancy. For the sake of simplicity, let's imagine that National Income is equal to GDP, in other words the Fixed Capital and the Statistical Discrepancy are equal to zero. In year 1, does the economy have a balanced budget, a budget surplus, or a budget deficit. Accompany your response with the corresponding dollar amount?arrow_forward3. Calculate GDP for an economy with exports of $5 trillion, investment of $1.5 trillion, consumption spending of $11 trillion, imports of $6 trillion, government purchases of $3 trillion.arrow_forward
- What is the change in GDP according to the *****income**** approach? How do the inputs that make up Net Domestic Income (wages, interest, and profits) change? I noticed that using the expenditure approach the GDP DECREASED by 800 dollars. My income approach is not working out.arrow_forward1. If imports are $2 trillion, exports are $1.9 trillion, consumption is $3.8 trillion, investment is $700 billion, and government spending is $1.1 trillion, how much is GDP? 2. If consumption is $2.5 trillion, investment is $900 billion, government spending is $700 billion, imports are $1.2 trillion and exports are $1.4 trillion, how much is GDP?arrow_forwardUse data below to answer the following questions:Consumption expenditures $300 billion, Government purchases $50 billionTaxes $40 billion, Investment $80 billion, Social Security payments $20 billionImports $30 billion, Exports $40 billiona) How much is GDP?b) How much are net exports?c) Social Security payments are government expenses. Should they be included in GDP? Explain.arrow_forward


 Brief Principles of Macroeconomics (MindTap Cours...EconomicsISBN:9781337091985Author:N. Gregory MankiwPublisher:Cengage Learning
 Essentials of Economics (MindTap Course List)EconomicsISBN:9781337091992Author:N. Gregory MankiwPublisher:Cengage Learning