
Concept explainers
Videos
Expand Your knowledge: Decimal Data The fallowing data represent tonnes of wheat harvested each year (1894-1925) from Plot 19 at the Rothamsted Agricultural Experiment Stations, England.
| 2.71 | 1.62 | 2.60 | 1.64 | 2.20 | 2.02 | 1.67 | 1.99 | 2.34 | 1.26 | 1.31 |
| 1.80 | 2.82 | 2.15 | 2.07 | 1.62 | 1.47 | 2.19 | 0.59 | 1.48 | 0.77 | 1.04 |
| 1.32 | 0.89 | 1.35 | 0.95 | 0.94 | 1.39 | 1.19 | 1.18 | 0.46 | 0.70 |
(a) Multiply each data value by 100 to “clear" the decimals.
(b) Use the standard procedures of this section to make a frequency table and histogram with your whole-number data. Use six classes.
(c) Divide class limits, class boundaries, and class midpoints by 100 to get back to your original data values.
(a)
To find: The data that are multiply with 100 for each value in the data..
Answer to Problem 21P
Solution: The data multiply with 100 for each value in the data is as follows:
| data | data*100 | data | data*100 | data | data*100 | data | data*100 |
| 2.71 | 271 | 2.34 | 234 | 1.47 | 147 | 1.35 | 135 |
| 1.62 | 162 | 1.26 | 126 | 2.19 | 219 | 0.95 | 95 |
| 2.6 | 260 | 1.31 | 131 | 0.59 | 59 | 0.94 | 94 |
| 1.64 | 164 | 1.8 | 180 | 1.48 | 148 | 1.39 | 139 |
| 2.2 | 220 | 2.82 | 282 | 0.77 | 77 | 1.19 | 119 |
| 2.02 | 202 | 2.15 | 215 | 2.04 | 204 | 1.18 | 118 |
| 1.67 | 167 | 2.07 | 207 | 1.32 | 132 | 0.46 | 46 |
| 1.99 | 199 | 1.62 | 162 | 0.89 | 89 | 0.7 | 70 |
Explanation of Solution
Calculation: The data represent the tons of wheat harvested each year and there are 32 values in the data set. To find the decimal data in to “clear” data that multiply with each value in the data by 100. The calculation is as follows:
| Data | Data*100 | Data | Data*100 | Data | Data*100 | Data | Data*100 |
| 2.71 | 2.34 | 234 | 1.47 | 147 | 1.35 | 135 | |
| 1.62 | 1.26 | 126 | 2.19 | 219 | 0.95 | 95 | |
| 2.6 | 1.31 | 131 | 0.59 | 59 | 0.94 | 94 | |
| 1.64 | 164 | 1.8 | 180 | 1.48 | 148 | 1.39 | 139 |
| 2.2 | 220 | 2.82 | 282 | 0.77 | 77 | 1.19 | 119 |
| 2.02 | 202 | 2.15 | 215 | 2.04 | 204 | 1.18 | 118 |
| 1.67 | 167 | 2.07 | 207 | 1.32 | 132 | 0.46 | 46 |
| 1.99 | 199 | 1.62 | 162 | 0.89 | 89 | 0.7 | 70 |
Interpretation: Hence, the data multiplied with 100 is as follows:
| Data | Data*100 | Data | Data*100 | Data | Data*100 | Data | Data*100 |
| 2.71 | 271 | 2.34 | 234 | 1.47 | 147 | 1.35 | 135 |
| 1.62 | 162 | 1.26 | 126 | 2.19 | 219 | 0.95 | 95 |
| 2.6 | 260 | 1.31 | 131 | 0.59 | 59 | 0.94 | 94 |
| 1.64 | 164 | 1.8 | 180 | 1.48 | 148 | 1.39 | 139 |
| 2.2 | 220 | 2.82 | 282 | 0.77 | 77 | 1.19 | 119 |
| 2.02 | 202 | 2.15 | 215 | 2.04 | 204 | 1.18 | 118 |
| 1.67 | 167 | 2.07 | 207 | 1.32 | 132 | 0.46 | 46 |
| 1.99 | 199 | 1.62 | 162 | 0.89 | 89 | 0.7 | 70 |
(b)
To find: The class width, class limits, class boundaries, midpoint, frequency, relative frequency, and cumulative frequency of the data..
Answer to Problem 21P
Solution: The complete frequency table is as follows:
| class limits | class boundaries | midpoints | freq | relative freq | cumulative freq |
| 46-85 | 45.5-85.5 | 65.5 | 4 | 0.12 | 4 |
| 86-125 | 85.5-125.5 | 105.5 | 5 | 0.16 | 9 |
| 126-165 | 125.5-165.5 | 145.5 | 10 | 0.31 | 19 |
| 166-205 | 165.5-205.5 | 185.5 | 5 | 0.16 | 24 |
| 206-245 | 205.5-245.5 | 225.5 | 5 | 0.16 | 29 |
| 246-285 | 245.5-285.5 | 265.5 | 3 | 0.09 | 32 |
Explanation of Solution
Calculation: To find the class width for the whole data of 32 values, it is observed that largest value of the data set is 282 and the smallest value is 46 in the data. Using 6 classes, the class width calculated in the following way:
The value is round up to the nearest whole number. Hence, the class width of the data set is 40. The class width for the data is 40 and the lowest data value (46) will be the lower class limit of the first class. Because the class width is 40, it must add 40 to the lowest class limit in the first class to find the lowest class limit in the second class. There are 6 desired classes. Hence, the class limits are 46–85, 86–125, 126–165, 166–205, 206–245, and 246–285. Now, to find the class boundaries subtract 0.5 from lower limit of every class and add 0.5 to the upper limit of every class interval. Hence, the class boundaries are 45.5–85.5, 85.5–125.5, 125.5–165.5, 165.5–205.5, 205.5–245.5, and 245.5–285.5.
Next to find the midpoint of the class is calculated by using formula,
Midpoint of first class is calculated as:
The frequencies for respective classes are 4, 5, 10, 5, 5, and 3.
Relative frequency is calculated by using the formula
The frequency for 1st class is 4 and total frequencies are 32 so the relative frequency is
The calculated frequency table is as follows:
| Class limits | Class boundaries | Midpoints | Freq | Relative freq | Cumulative freq |
| 46-85 | 45.5-85.5 | 65.5 | 4 | 0.12 | 4 |
| 86-125 | 85.5-125.5 | 105.5 | 5 | 0.16 | 9 |
| 126-165 | 125.5-165.5 | 145.5 | 10 | 0.31 | 19 |
| 166-205 | 165.5-205.5 | 185.5 | 5 | 0.16 | 24 |
| 206-245 | 205.5-245.5 | 225.5 | 5 | 0.16 | 29 |
| 246-285 | 245.5-285.5 | 265.5 | 3 | 0.09 | 32 |
Graph: To construct the histogram by using the MINITAB, the steps are as follows:
Step 1: Enter the class boundaries in C1 and frequency in C2.
Step 2: Go to Graph > Histogram > Simple.
Step 3: Enter C1 in Graph variable then go to Data options > Frequency > C2.
Step 4: Click on OK.
The obtained histogram is as follows:
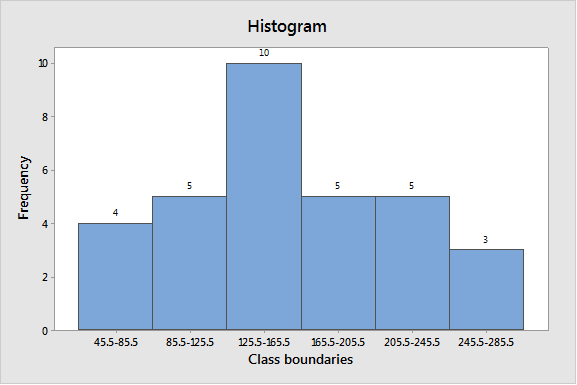
Interpretation: Hence, the complete frequency table is as follows:
| Class limits | Class boundaries | Midpoints | Freq | Relative freq | Cumulative freq |
| 46-85 | 45.5-85.5 | 65.5 | 4 | 0.12 | 4 |
| 86-125 | 85.5-125.5 | 105.5 | 5 | 0.16 | 9 |
| 126-165 | 125.5-165.5 | 145.5 | 10 | 0.31 | 19 |
| 166-205 | 165.5-205.5 | 185.5 | 5 | 0.16 | 24 |
| 206-245 | 205.5-245.5 | 225.5 | 5 | 0.16 | 29 |
| 246-285 | 245.5-285.5 | 265.5 | 3 | 0.09 | 32 |
(c)
To find: The class limits, class boundaries, and midpoints in the table by dividing 100..
Answer to Problem 21P
Solution: The frequency table of original data is as:
| class limits | class boundaries | Midpoints |
| 0.46-0.85 | 0.455-0.855 | 0.655 |
| 0.86-1.25 | 0.855-1.255 | 1.055 |
| 1.26-1.65 | 1.255-1.655 | 1.455 |
| 1.66-2.05 | 1.655-2.055 | 1.855 |
| 2.06-2.45 | 2.055-2.455 | 2.255 |
| 2.46-2.85 | 2.455-2.855 | 2.655 |
Explanation of Solution
Calculation: The frequency table for whole number is obtained in above part. It is the data that multiply each value by 100 to ‘clear’ decimals from the data. The frequency table for whole number is as follows:
| class limits | class boundaries | Midpoints |
| 46-85 | 45.5-85.5 | 65.5 |
| 86-125 | 85.5-125.5 | 105.5 |
| 126-165 | 125.5-165.5 | 145.5 |
| 166-205 | 165.5-205.5 | 185.5 |
| 206-245 | 205.5-245.5 | 225.5 |
| 246-285 | 245.5-285.5 | 265.5 |
To find the decimal or original data, divide the class limits, class boundaries and midpoints by 100. The calculation as follows:
| class limits | class boundaries | Midpoints |
| 0.46-0.85 | 0.455-0.855 | 0.655 |
| 0.86-1.25 | 0.855-1.255 | 1.055 |
| 1.26-1.65 | 1.255-1.655 | 1.455 |
| 1.66-2.05 | 1.655-2.055 | 1.855 |
| 2.06-2.45 | 2.055-2.455 | 2.255 |
| 2.46-2.85 | 2.455-2.855 | 2.655 |
Interpretation: Hence, the data divide by 100 is as:
| class limits | class boundaries | Midpoints |
| 0.46-0.85 | 0.455-0.855 | 0.655 |
| 0.86-1.25 | 0.855-1.255 | 1.055 |
| 1.26-1.65 | 1.255-1.655 | 1.455 |
| 1.66-2.05 | 1.655-2.055 | 1.855 |
| 2.06-2.45 | 2.055-2.455 | 2.255 |
| 2.46-2.85 | 2.455-2.855 | 2.655 |
Want to see more full solutions like this?
Chapter 2 Solutions
UNDERSTANDING BASIC STAT LL BUND >A< F


- Running Speed A man is running around a circular track that is 200 m in circumference. An observer uses a stopwatch to record the runner’s time at the each of each lap, obtaining the data in the following table. (a) What was the man’s average speed (rate) between 68 s and 152 s? (b) What was the man’s average speed between 263 s and 412 s? (c) Calculate the man’s speed for cadi lap, Is he slowing down, speeding up, or neither?arrow_forwardRunning Speed A man is running around a circular track that is 200 m in circumference. An observer uses a stopwatch to record the runners time at the end of each lap, obtaining the data in the following table. aWhat was the mans average speed rate between 68 s and 152 s? bWhat was the mans average speed between 263 s and 412 s? cCalculate the mans speed for each lap. Is he slowing down, speeding up or neither? Time s Distance m 32 200 68 400 108 600 152 800 203 1000 263 1200 335 1400 412 1600arrow_forwardMarginal Tax Rate The following table shows tax due for the given taxable income level for a single taxpayer. Taxable income Tax due 97, 000 21, 913 97, 050 21, 927 97, 100 21, 941 97, 150 21, 955 97, 200 21, 969 a. Show that the data in the table are linear. b. How much additional tax is due on each dollar over 97.000? c. What would you expect to be your tax due if you had a taxable income of 97, 000? of 98, 000? d. Find a linear formula that gives your tax due if your income is A dollars over 97, 000.arrow_forward
- Urban Travel Times Population of cities and driving times are related, as shown in the accompanying table, which shows the 1960 population N, in thousands, for several cities, together with the average time T, in minutes, sent by residents driving to work. City Population N Driving time T Los Angeles 6489 16.8 Pittsburgh 1804 12.6 Washington 1808 14.3 Hutchinson 38 6.1 Nashville 347 10.8 Tallahassee 48 7.3 An analysis of these data, along with data from 17 other cities in the United States and Canada, led to a power model of average driving time as a function of population. a Construct a power model of driving time in minutes as a function of population measured in thousands b Is average driving time in Pittsburgh more or less than would be expected from its population? c If you wish to move to a smaller city to reduce your average driving time to work by 25, how much smaller should the city be?arrow_forwardPlanetary Velocity The following table gives the mean velocity of planets in their orbits versus their mean distance from the sun. Note that 1AU astronomical unit is the mean distance from Earth to the sun, abut 93 million miles. Planet d=distance AU v=velocity km/sec Mercury 0.39 47.4 Venus 0.72 35.0 Earth 1.00 29.8 Mars 1.52 24.1 Jupiter 5.20 13.1 Saturn 9.58 9.7 Uranus 19.20 6.8 Neptune 30.05 5.4 Astronomers tell us that it is reasonable to model these data with a power function. a Use power regression to express velocity as a power function of distance from the sun. b Plot the data along with the regression equation. c An asteroid orbits at a mean distance of 3AU from the sun. According to the power model you found in part a, what is the mean orbital velocity of the asteroid?arrow_forward
 Functions and Change: A Modeling Approach to Coll...AlgebraISBN:9781337111348Author:Bruce Crauder, Benny Evans, Alan NoellPublisher:Cengage Learning
 Big Ideas Math A Bridge To Success Algebra 1: Stu...AlgebraISBN:9781680331141Author:HOUGHTON MIFFLIN HARCOURTPublisher:Houghton Mifflin Harcourt
 Algebra and Trigonometry (MindTap Course List)AlgebraISBN:9781305071742Author:James Stewart, Lothar Redlin, Saleem WatsonPublisher:Cengage Learning
 College AlgebraAlgebraISBN:9781305115545Author:James Stewart, Lothar Redlin, Saleem WatsonPublisher:Cengage Learning
 Linear Algebra: A Modern IntroductionAlgebraISBN:9781285463247Author:David PoolePublisher:Cengage Learning
 Glencoe Algebra 1, Student Edition, 9780079039897...AlgebraISBN:9780079039897Author:CarterPublisher:McGraw Hill