
Videos
World Military Expenditure The following chart shows total military and arms trade expenditure from 1992–2010 (
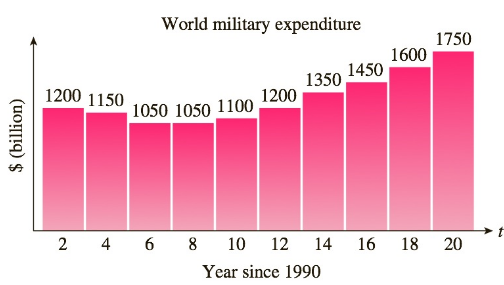
Source: www.globalissues.org/Geopolitics/ArmsTrade/Spending.asp.
a. If you want to model the expenditure figures with a function of the form
b. Which of the following models best approximates the data given? (Try to answer this without actually computing values.)
A.
B.
C.
D.
c. What is the nearest year that would correspond to the vertex of the graph of the correct model from part (b)? What is the danger of extrapolating the data in either direction?
Want to see the full answer?
Check out a sample textbook solution
Chapter 2 Solutions
Finite Mathematics and Applied Calculus (MindTap Course List)


- The annual profit P (in dollars) of a company is modeled by a function of the form P=at^2+bt+c where t represents the year. Discuss which of the models below the company might prefer. a. a is positive and t is greater than equal to b/2a. b. a is positive and t is less than equal to -b/2a c. a is negative and t is greater than -b/2a d. a is negative and t is less than equal to -b/2aarrow_forwardA machine is now worth $146,200 and will be depreciated linearly over a 6-year period, at which time it will be worth $70,240 as scrap (a) Find the rule of depreciation function (b) What is the domain of f? (c) What will the machine be worth in 3 years?arrow_forwardThe idea of a large, stable middle class (defined as those with annual household incomes in 2010 between $39, 000 and $118, 000 for a family of three) is central to America’s sense of itself. The following table gives the percentage of middle-income adults in the United States from 1971 through 2011: Year 1971 1981 1991 2001 2011 Percent 61 59 56 54 51 A mathematical model giving the percentage of middle-class adults in the United States for the period under consideration is given by f(t) = −2.5t = 61.2 (0 ≤ t ≤ 4) where t is measured in decades, with t = 0 corresponding to 1971. (a) Plot the data points, and sketch the graph of f the function on the same set of axes.(b) What is the rate of change of the percentage of middle-income adults in the United States over the period from 1971 to 2011? (c) Assuming that the trend continues, what will the percentage of middle-income adults in the United States be in 2021?arrow_forward
 Algebra & Trigonometry with Analytic GeometryAlgebraISBN:9781133382119Author:SwokowskiPublisher:Cengage