
Financial And Managerial Accounting
15th Edition
ISBN: 9781337902663
Author: WARREN, Carl S.
Publisher: Cengage Learning,
expand_more
expand_more
format_list_bulleted
Videos
Textbook Question
Chapter 21, Problem 4MAD
Segment disclosure by Apple Inc. (AAPL) provides sales information for its major product lines for three recent years as follows (in millions):
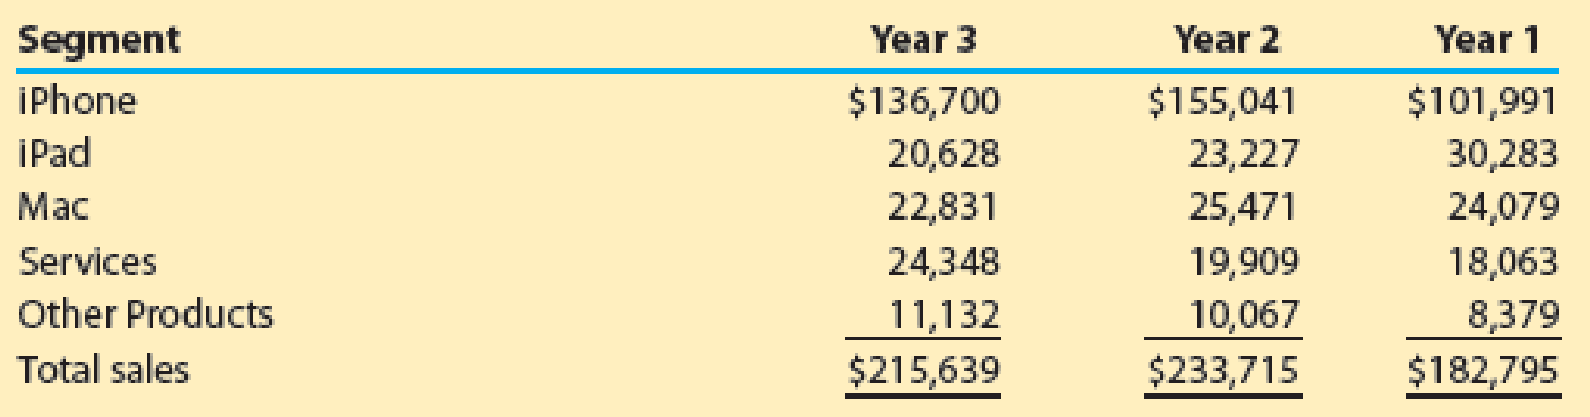
The Services segment includes sales from iTunes Store, App Store, Mac App Store, TV App Store, iBooks Store, Apple Music, AppleCare, and Apple Pay. The Other Products segment includes sales from Apple TV, Apple Watch, Beats products, iPod, and Apple-branded accessories.
- a. Which product had the greatest percentage of Year 3 sales? Which product had the least percentage of Year 3 sales? Round to nearest whole percent.
- b. Which product grew the most in sales, in percentage terms, using Year 1 as the base year? Round to nearest whole percent.
Expert Solution & Answer

Trending nowThis is a popular solution!

Students have asked these similar questions
Analyze Apple Inc. by segment
Segment disclosure by Apple Inc. (AAPL) provides sales information for its major product lines for three recent years as follows (in millions):
Segment
Year 3
Year 2
Year 1
iPhone
$137,781
$142,381
$164,888
Mac
28,622
25,740
25,198
iPad
23,724
21,280
18,380
Wearables, Home Accessories
30,620
24,482
17,381
Services
53,768
46,291
39,748
Total
$274,515
$260,174
$265,595
The Wearables, Home Accessories segment includes Airpods, Apple Watch, and Apple TV. The Services segment includes sales from iTunes Store, App Store, Mac App Store, TV App Store, iBooks Store, Apple Music, AppleCare, and Apple Pay.
Question Content Area
a. Prepare a vertical analysis of Year 3 sales. (Round percentages to nearest whole percent.)
Segment
Year 3Sales
Percent ofTotal Sales
iPhone
$137,781
fill in the blank
Mac
28,622
fill in the blank
iPad
23,724
fill in the blank
Wearables, Home Accessories
30,620
fill in the blank
Services
53,768
fill…
Analyze Apple Inc. by segment
Segment disclosure by Apple Inc. (AAPL) provides sales information for its major product lines for three recent years as follows (in millions):
Segment
Year 3
Year 2
Year 1
iPhone
$136,700
$155,041
$101,991
iPad
20,628
23,227
30,283
Mac
22,831
25,471
24,079
Services
24,348
19,909
18,063
Other Products
11,132
10,067
8,379
Total sales
$215,639
$233,715
$182,795
The Services segment includes sales from iTunes Store, App Store, Mac App Store, TV App Store, iBooks Store, Apple Music, AppleCare, and Apple Pay. The Other Products segment includes sales from Apple TV, Apple Watch, Beats products, iPod, and Apple-branded accessories.
a. Prepare a vertical analysis of Year 3 sales. (Round percentages to nearest whole percent.)
Vertical analysis
Amazon.com, Inc.is the largest Internet retailer in the United States. Amazon's income statements through income from operations for two recent years are as follows (in mH!ions):
Amazon.com,Inc.
Operating Income Statements
For the Years Ended December 31 (in millions)
Year 2
Year 1
Product sales
$70,080
$60,903
Service sales
18,908
13,549
Total sales
$88,988
$74,452
Cost of sales
$62,752
$54,181
Fulfillment
10,766
8,585
Marketing
4,332
3,133
Technology and content
9,275
6,565
General and administrative
1,552
1,129
Other operating expense (income), net
133
114
Total operating expenses
$88,810
$73,707
Income from operations
$ 178
$ 745
1.Prepare a vertical analysis of the two operating income statements.Round percentages to one decimal pl
2.Use the vertical analysis to explain the decrease in income from operations.
Chapter 21 Solutions
Financial And Managerial Accounting
Ch. 21 - What types of costs are customarily included in...Ch. 21 - Which type of manufacturing cost (direct...Ch. 21 - Which of the following costs would be included in...Ch. 21 - In the variable costing income statement, how are...Ch. 21 - The manager of a company are planning to...Ch. 21 - Since all costs of operating a business are...Ch. 21 - Discuss how financial data prepared on the basis...Ch. 21 - Why might management analyze product...Ch. 21 - Explain why rewarding sales personnel on the basis...Ch. 21 - Explain why service companies use different...
Ch. 21 - Variable costing Marley Company has the following...Ch. 21 - Variable costingproduction exceeds sales Fixed...Ch. 21 - Variable costingsales exceed production The...Ch. 21 - Analyzing income under absorption and variable...Ch. 21 - Contribution margin by segment The following...Ch. 21 - At the end of the first year of operations, 21,500...Ch. 21 - Gallatin County Motors Inc. assembles and sells...Ch. 21 - Fresno Industries Inc. manufactures and sells...Ch. 21 - On March 31, the end of the first month of...Ch. 21 - On April 30, the end of the first month of...Ch. 21 - On October 31, the end of the first month of...Ch. 21 - The following data were adapted from a recent...Ch. 21 - Estimated income statements, using absorption and...Ch. 21 - The following data were adapted from a recent...Ch. 21 - How is the quantity factor for an increase or a...Ch. 21 - Explain why service companies use different...Ch. 21 - Galaxy Sports Inc. manufactures and sells two...Ch. 21 - Prob. 13ECh. 21 - Sales territory and salesperson profitability...Ch. 21 - Prob. 15ECh. 21 - Prob. 16ECh. 21 - Variable costing income statement for a service...Ch. 21 - Variable costing income statement for a service...Ch. 21 - Absorption and variable costing income statements...Ch. 21 - Prob. 2PACh. 21 - During the first month of operations ended May 31,...Ch. 21 - Salespersons report and analysis Walthman...Ch. 21 - Segment variable costing income statement and...Ch. 21 - Absorption and variable costing income statements...Ch. 21 - Income statements under absorption costing and...Ch. 21 - Absorption and variable costing income statements...Ch. 21 - Salespersons report and analysis Pachec Inc....Ch. 21 - Prob. 5PBCh. 21 - Comcast Corporation (CMCSA) is a global media and...Ch. 21 - Prob. 2MADCh. 21 - Prob. 3MADCh. 21 - Segment disclosure by Apple Inc. (AAPL) provides...Ch. 21 - Prob. 1TIFCh. 21 - Inventory effects under absorption costing BendOR,...Ch. 21 - Communication Bon Jager Inc. manufactures and...Ch. 21 - Data for the last fiscal year for Merlene Company...Ch. 21 - Chassen Company, a cracker and cookie...Ch. 21 - Mill Corporation had the following unit costs for...Ch. 21 - Bethany Company has just completed the first month...
Knowledge Booster


Learn more about
Need a deep-dive on the concept behind this application? Look no further. Learn more about this topic, accounting and related others by exploring similar questions and additional content below.Similar questions
- Apple Inc.: Segment revenue analysis Segment disclosure by Apple Inc. provides sales information for its major product lines for three recent years as follows (in millions): A. Which product had the greatest percentage of Year 3 sales? Which product had the least percentage of Year 3 sales? (Round to nearest whole percent.) B. Which product grew the most in sales, in percentage terms, using Year 1 as the base year? (Round to nearest whole percent.)arrow_forwardApple Inc. designs, manufactures, and markets personal computers and related personal computing and communicating solutions for sale primarily to education, creative, consumer, and business customers. Substantially all of the companys sales over the last five years are from sales of its Macs, iPods, iPads, and related software and peripherals. For two recent fiscal years, Apple reported the following (in millions): Assume that the accounts receivable (in millions) were 24,094 at the beginning of fiscal Year 1. 1. Compute the accounts receivable turnover for Year 2 and Year 1. Round to two decimal places. 2. Compute the days sales in receivables at the end of Year 2 and Year 1. Use 365 days and round to one decimal place. 3. What conclusions can be drawn from (1) and (2) regarding Apples efficiency in collecting receivables?arrow_forwardVertical analysis Amazon.com, Inc. is the largest Internet retailer in the United States. Amazon’s income statements through income from operations for two recent years are as follows (in millions): Amazon.com, Inc. Operating Income Statements For the Years Ended December 31 (in millions) Year 2 Year 1 Product sales $70,080 $60,903 Service sales 18,908 13,549 Total sales $88,988 $74,452 Cost of sales $62,752 $54,181 Fulfillment 10,766 8,585 Marketing 4,332 3,133 Technology and content 9,275 6,565 General and administrative 1,552 1,129 Other operating expense (income), net 133 114 Total operating expenses $88,810 $73,707 Income from operations $178 $745 Required: a. Prepare a vertical analysis of the two operating income statements. Round percentages to one decimal place.arrow_forward
- Vertical analysis Amazon.com, Inc. is the largest Internet retailer in the United States. Amazon’s income statements through income from operations for two recent years are as follows (in millions): Amazon.com, Inc. Operating Income Statements For the Years Ended December 31 (in millions) Year 2 Year 1 Product sales $70,080 $60,903 Service sales 18,908 13,549 Total sales $88,988 $74,452 Cost of sales $62,752 $54,181 Fulfillment 10,766 8,585 Marketing 4,332 3,133 Technology and content 9,275 6,565 General and administrative 1,552 1,129 Other operating expense (income), net 133 114 Total operating expenses $88,810 $73,707 Income from operations $178 $745 Required: a. Prepare a vertical analysis of the two operating income statements. Round percentages to one decimal place. Amazon.com, Inc. Operating Income Statements For the Years Ended December 31 (in millions) Year 2 Year 1 Amount Percent Amount Percent Product sales…arrow_forwardThe following revenue data were taken from the December 31, 2017, Coca-Cola annual report (10-K): For each segment and each year, calculate intersegment sales (another name for transfer sales) as a percentage of total sales, Using Microsoft Excel or another spreadsheet application, create a clustered column graph to show the 2016 and 2017 percentages for each division. Comment on your observations of this data. How might a division sales manager use this data?arrow_forwardThe general merchandise retail industry has a number of segments represented by the following companies: For a recent year, the following cost of goods sold and beginning and ending inventories are provided from corporate annual reports (in millions) for these three companies: a. Determine the inventory turnover ratio for all three companies. Round all calculations to one decimal place. b. Determine the number of days sales in inventory for all three companies. Use 365 days and round all calculations to one decimal place. c. Interpret these results based on each companys merchandising concept.arrow_forward
- Polo Ralph Lauren Corporation designs, markets, and distributes a variety of apparel, home decor, accessory, and fragrance products. The companys products include such brands as Polo by Ralph Lauren, Ralph Lauren Purple Label, Ralph Lauren, Polo Jeans Co., and Chaps. Polo Ralph Lauren reported the following (in thousands) for two recent years: Assume that accounts receivable (in millions) were 486,200 at the beginning of Year 1. a. Compute the accounts receivable turnover for Year 2 and Year 1. Round to one decimal place. b. Compute the days sales in receivables for Year 2 and Year 1. Use 365 days and round to one decimal place. c. What conclusions can be drawn from these analyses regarding Ralph Laurens efficiency in collecting receivables?arrow_forwardRalph Lauren Corporation designs, markets, and distributes a variety of apparel, home decor, accessory, and fragrance products. The companys products include such brands as Polo by Ralph Lauren, Ralph Lauren Purple Label, Ralph Lauren, Polo Jeans Co., and Chaps. Polo Ralph Lauren reported the following (in thousands) for two recent years: Assume that accounts receivable (in millions) were 607,000 at the beginning of Year 1. a. Compute the accounts receivable turnover for Year 2 and Year 1. Round to two decimal places. b. Compute the days sales in receivables for Year 2 and Year 1. Use 365 days and round to one decimal place. c. What conclusions can be drawn from these analyses regarding Ralph Laurens efficiency in collecting receivables?arrow_forwardAmazon.com, Inc. (AMZN) is one of the largest Internet retailers in the world. Target Corporation (TGT) is one of the largest value-priced general merchandisers operating in the United States. Target sells through nearly 1,800 brick-and-mortar stores and through the Internet. Amazon and Target compete for customers across a wide variety of products, including media, general merchandise, apparel, and consumer electronics. Cost of goods sold and inventory information from a recent annual report are provided for both companies as follows (in millions): a. Compute the inventory turnover for both companies. Round all calculations to one decimal place. b. Compute the number of days sales in inventory for both companies. Use 365 days and round all calculations to one decimal place. c. Which company has the better inventory efficiency? d. What might explain the difference in inventory efficiency between the two companies?arrow_forward
- Starship Corporation reported the following geographical segment revenues for a recent and a prior fiscal year: Recent Year(in millions, rounded) Prior Year(in millions, rounded) Americas $10,479 $8,073 EMEA* 1,217 1,295 China/Asia Pacific 2,396 1,130 Channel Development** 1,731 1,546 Other 2,236 1,695 Total $18,059 $13,739 *Europe, Middle East, and Africa **Sells packaged coffee and teas globally a. Prepare a horizontal analysis of the segment data using the prior year as the base year. Round all percents to one decimal place. Enter all amounts in millions. If required, use minus sign to indicate the decreasing values. Starship Corporation Horizontal Analysis Recent Year (in millions) Prior Year (in millions) Increase (Decrease)Amount Increase (Decrease)Percent Americas $10,479 $8,073 $fill in the blank 15396ff9101df9f_1 fill in the blank 15396ff9101df9f_2% EMEA 1,217 1,295 fill in the blank 15396ff9101df9f_3 fill…arrow_forwardCommon-Sized Income Statement Revenue and expense data for the current calendar year for Tannenhill Company and for the electronics industry are as follows. Tannenhill's data are expressed in dollars. The electronics industry averages are expressed in percentages. TannenhillCompany ElectronicsIndustryAverage Sales $4,000,000 100.0 % Cost of goods sold (2,120,000) (60.0) Gross profit $1,880,000 40.0 % Selling expenses $(1,080,000) (24.0) % Administrative expenses (640,000) (14.0) Total operating expenses $(1,720,000) (38.0) % Operating income $160,000 2.0 % Other revenue and expense: Other revenue 120,000 3.0 Other expense (80,000) (2.0) Income before income tax expense $200,000 3.0 % Income tax expense (80,000) (2.0) Net income $120,000 1.0 % a. Prepare a common-sized income statement comparing the results of operations for Tannenhill Company with the…arrow_forward
arrow_back_ios
arrow_forward_ios
Recommended textbooks for you
 Managerial AccountingAccountingISBN:9781337912020Author:Carl Warren, Ph.d. Cma William B. TaylerPublisher:South-Western College PubFinancial And Managerial AccountingAccountingISBN:9781337902663Author:WARREN, Carl S.Publisher:Cengage Learning,
 Financial & Managerial AccountingAccountingISBN:9781337119207Author:Carl Warren, James M. Reeve, Jonathan DuchacPublisher:Cengage Learning
 Principles of Accounting Volume 2AccountingISBN:9781947172609Author:OpenStaxPublisher:OpenStax College
 Financial AccountingAccountingISBN:9781305088436Author:Carl Warren, Jim Reeve, Jonathan DuchacPublisher:Cengage Learning
Managerial Accounting
Accounting
ISBN:9781337912020
Author:Carl Warren, Ph.d. Cma William B. Tayler
Publisher:South-Western College Pub
Financial And Managerial Accounting
Accounting
ISBN:9781337902663
Author:WARREN, Carl S.
Publisher:Cengage Learning,
Financial & Managerial Accounting
Accounting
ISBN:9781337119207
Author:Carl Warren, James M. Reeve, Jonathan Duchac
Publisher:Cengage Learning
Principles of Accounting Volume 2
Accounting
ISBN:9781947172609
Author:OpenStax
Publisher:OpenStax College
Financial Accounting
Accounting
ISBN:9781305088436
Author:Carl Warren, Jim Reeve, Jonathan Duchac
Publisher:Cengage Learning
How To Analyze an Income Statement; Author: Daniel Pronk;https://www.youtube.com/watch?v=uVHGgSXtQmE;License: Standard Youtube License