Concept explainers
Videos
Slopes of Secant Lines In Exercises 7 and 8, use the graph shown in the figure. To print an enlarged copy of file graph, go to MalhGraphs.com.
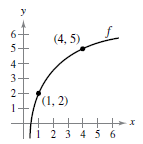
Identify or sketch each of the quantities on the figure.
(a)
(b)
(c)
(d)
Want to see the full answer?
Check out a sample textbook solution
Chapter 2 Solutions
Calculus (MindTap Course List)


- Projectile Motion In Exercises 75 and 76, consider the path of an object projected horizontally with a velocity of v feet per second at a height of s feet, where the model for the path is x2=v216ys. In this model (in which air resistance is disregarded), y is the height (in feet) of the projectile and x is the horizontal distance (in feet) the projectile travels. A ball is thrown from the top of a 100-foot tower with a velocity of 28 feet per second. (a) Write an equation for the parabolic path. (b) How far does the ball travel horizontally before it strikes the ground?arrow_forwardPopulation Statistics The table shows the life expectancies of a child (at birth) in the United States for selected years from 1940 through 2010. A model for the life expectancy during this period is y=63.6+0.97t1+0.01t,0t70 Where y represents the life expectancy and t is the time in years, with t = 0 corresponding to 1940. (a) Use a graphing utility to graph the data from the table and the model in the same viewing window. How well does the model fit the data? Explain. (b) Determine the life expectancy in 1990 both graphically and algebraically. (c) Use the graph to determine the year when life expectancy was approximately 70.1. verify your answer algebraically. (d) Find the y-intercept of the graph of the model. What does it represent in the context of the problem? (e) Do you think this model can be used to predict the life expectancy of a child 50 years from now?arrow_forwardChange in Direction A graph of directed distance switches from increasing to decreasing. What happens to velocity?arrow_forward
- Population Statistics The table shows the life expectancies of a child (at birth) in the United States for selected years from 1940 through 2010. A model for the life expectancy during this period is y=63.6+0.97t1+0.01t,0r70 Where y represents the life expectancy and t is the time in years, with t=0 corresponding to 1940. (a) Use a graphing utility to graph the data from the table and the model in the same viewing window. How well does the model fit the data? Explain (b) Determine the life expectancy in 1990 both graphically and algebraically. (c) Use the graph to determine the year when life expectancy was approximately 70.1. Verify your answer algebraically. (d) Identify the y-intercept of the graph of the model. What does it represent in the context of the problem? (e) Do you think this model can be used to predict the life expectancy of a child 50 years from now? Explainarrow_forwardSign of VelocityWhen the graph of directed distance is decreasing, is the graph of velocity above or below the horizontal axis?arrow_forwardrotated about the line x = −2. Sketch the graph and approximating strip.arrow_forward
- 1- A tank holds 1,000 gallons of water, which drains from the bottom of the tank in half an hour. The values in the table show the volume V of water remaining in the tank (in gallons) after t minutes. t (min) 5 10 15 20 25 30 V (gal) 692 445 255 115 29 0 (a) If P is the point (15, 255) on the graph of V, find the slopes of the secant lines PQ when Q is the point on the graph with t = 5, 10, 20, 25, and 30. (Round your answers to one decimal place.) Q Slope (5, 692) ------ (10, 445) ------ (20, 115) ------ (25, 29) ------- (30, 0) ------- (b) Estimate the slope of the tangent line at P by averaging the slopes of the two adjacent secant lines corresponding to the two points closest to P. (Round your answer to one decimal place.) ---------------- 2- The point P(8, −2) lies on the curve y= 2/7-x (a) If Q is the point (x,2/7-x), find the slope of the secant line PQ (correct to six decimal places) for the following values of x. (i)…arrow_forwardReflection over the line y=xarrow_forwardLevel curves: Sketch the level curves f (x, y) = c of the followingfunctions for c = −3, −2, −1, 0, 1, 2, and 3:1. f (x, y) = −2y/x2. f (x, y) = y2 − x23. f (x, y) = x −sin−1 y 4. f (x, y) = x sec yarrow_forward
 Algebra & Trigonometry with Analytic GeometryAlgebraISBN:9781133382119Author:SwokowskiPublisher:Cengage
 Trigonometry (MindTap Course List)TrigonometryISBN:9781337278461Author:Ron LarsonPublisher:Cengage Learning
 Functions and Change: A Modeling Approach to Coll...AlgebraISBN:9781337111348Author:Bruce Crauder, Benny Evans, Alan NoellPublisher:Cengage Learning