
Concept explainers
Videos
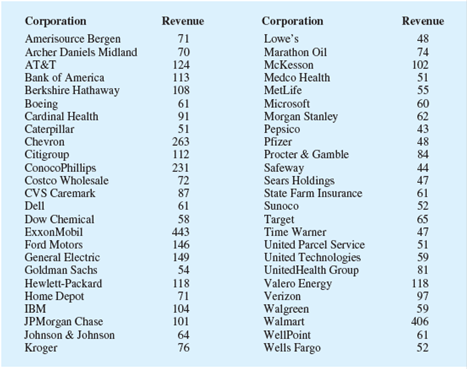
Fortune provides a list of America’s largest corporations based on annual revenue. Shown below are the 50 largest corporations, with annual revenue expressed in billions of dollars (CNN Money website, January 15, 2010).
Summarize the data by constructing the following:
- a. A frequency distribution (classes 0–49, 50–99, 100–149, and so on).
- b. A relative frequency distribution.
- c. A cumulative frequency distribution.
- d. A cumulative relative frequency distribution.
- e. what do these distributions tell you about the annual revenue of the largest corporations in America?
- f. Show a histogram. Comment on the shape of the distribution.
- g. what is the largest corporation in America and what is its annual revenue?
a.
Construct a frequency distribution for the data.
Answer to Problem 21E
The frequency distribution is,
| Revenue | Frequency |
| 0-49 | 6 |
| 50-99 | 29 |
| 100-149 | 11 |
| 150-199 | 0 |
| 200-249 | 1 |
| 250-299 | 1 |
| 300-349 | 0 |
| 350-399 | 0 |
| 400-449 | 2 |
| Total | 50 |
Explanation of Solution
Calculation:
The data represents the list of 50 America’s largest corporations with annual revenue expressed in billions of dollars and the frequency distribution is constructed by using the class 0-49, 40-99,100-149 and so on.
Frequency:
The frequencies are calculated by using the tally mark and the range of the data is from 0 to 449.
- Based on the given information, the class intervals are 0-49, 40-99,100-149, …, 400-449.
- Make a tally mark for each value in the corresponding revenue class and continue for all values in the data.
- The number of tally marks in each class represents the frequency, f of that class.
Similarly, the frequency of remaining classes for the revenue is given below:
| Revenue | Tally | Frequency |
| 0-49 | 6 | |
| 50-99 | 29 | |
| 100-149 | 11 | |
| 150-199 | 0 | |
| 200-249 | 1 | |
| 250-299 | 1 | |
| 300-349 | 0 | |
| 350-399 | 0 | |
| 400-449 | 2 | |
| Total | 50 |
b.
Construct a relative frequency distribution for the data.
Answer to Problem 21E
The relative frequency distribution is,
| Revenue | Frequency | Relative frequency |
| 0-49 | 6 | 0.12 |
| 50-99 | 29 | 0.58 |
| 100-149 | 11 | 0.22 |
| 150-199 | 0 | 0.00 |
| 200-249 | 1 | 0.02 |
| 250-299 | 1 | 0.02 |
| 300-349 | 0 | 0.00 |
| 350-399 | 0 | 0.00 |
| 400-449 | 2 | 0.04 |
| Total | 50 | 1.00 |
Explanation of Solution
Calculation:
Relative frequency:
The general formula for the relative frequency is,
For the revenue class (0-49), substitute frequency as “6” and total frequency as “50”.
Similarly, the relative frequencies for the remaining revenue classes are obtained below:
| Revenue | Frequency | Relative frequency |
| 0-49 | 6 | 0.12 |
| 50-99 | 29 | 0.58 |
| 100-149 | 11 | 0.22 |
| 150-199 | 0 | 0.00 |
| 200-249 | 1 | 0.02 |
| 250-299 | 1 | 0.02 |
| 300-349 | 0 | 0.00 |
| 350-399 | 0 | 0.00 |
| 400-449 | 2 | 0.04 |
| Total | 50 | 1.00 |
c.
Construct a cumulative frequency distribution for the data.
Answer to Problem 21E
The cumulative frequency distribution is,
| Revenue | Frequency | Cumulative frequency |
| 0-49 | 6 | 6 |
| 50-99 | 29 | 35 |
| 100-149 | 11 | 46 |
| 150-199 | 0 | 46 |
| 200-249 | 1 | 47 |
| 250-299 | 1 | 48 |
| 300-349 | 0 | 48 |
| 350-399 | 0 | 48 |
| 400-449 | 2 | 50 |
Explanation of Solution
Calculation:
Cumulative frequency:
Cumulative frequency of a particular class is the sum of all frequencies up to that class. The last class’s cumulative frequency is equal to the sample size
Thus, the cumulative frequency for each class is tabulated below:
Thus the relative frequencies for the five types of classes are obtained below:
| Revenue | Frequency | Cumulative frequency |
| 0-49 | 6 | 6 |
| 50-99 | 29 | |
| 100-149 | 11 | |
| 150-199 | 0 | |
| 200-249 | 1 | |
| 250-299 | 1 | |
| 300-349 | 0 | |
| 350-399 | 0 | |
| 400-449 | 2 |
d.
Construct a cumulative relative frequency distribution for the data.
Answer to Problem 21E
The cumulative relative frequency distribution is,
| Revenue | Cumulative relative frequency |
| 0-49 | 0.12 |
| 50-99 | 0.70 |
| 100-149 | 0.92 |
| 150-199 | 0.92 |
| 200-249 | 0.94 |
| 250-299 | 0.96 |
| 300-349 | 0.96 |
| 350-399 | 0.96 |
| 400-449 | 1.00 |
Explanation of Solution
Calculation:
Cumulative relative frequency of a particular class is the sum of all relative frequencies up to that class. The last class’s cumulative relative frequency is equal to the approximate value 1.00.
The relative frequencies for the revenue classes from part (b) is given below:
| Revenue | Frequency | Relative frequency |
| 0-49 | 6 | 0.12 |
| 50-99 | 29 | 0.58 |
| 100-149 | 11 | 0.22 |
| 150-199 | 0 | 0.00 |
| 200-249 | 1 | 0.02 |
| 250-299 | 1 | 0.02 |
| 300-349 | 0 | 0.00 |
| 350-399 | 0 | 0.00 |
| 400-449 | 2 | 0.04 |
| Total | 50 | 1.00 |
Thus, the cumulative relative frequencies for the revenue classes are obtained below:
| Revenue | Relative frequency | Cumulative relative frequency |
| 0-49 | 0.12 | 0.12 |
| 50-99 | 0.58 | |
| 100-149 | 0.22 | |
| 150-199 | 0.00 | |
| 200-249 | 0.02 | |
| 250-299 | 0.02 | |
| 300-349 | 0.00 | |
| 350-399 | 0.00 | |
| 400-449 | 0.04 |
e.
Explain about the annual revenue of the largest corporations in America using the distributions.
Explanation of Solution
From the given data set and obtained distributions, it is observed that the frequency for the revenues in the range of 50 billion dollars to 149 billion dollars is obtained by majority of 40 corporations over 50 largest corporations.
Further, the revenue over $200 billion is obtained by only 4 corporations and the revenue over 400 billion dollar is obtained by only 2 corporations.
Moreover, 70 percent of corporations have revenues under 100 billion dollars. Only 30 percent of corporations have revenues over 100 billion dollars.
f.
Construct the histogram and comment on the shape of the distribution.
Answer to Problem 21E
- Output using MINITAB software is given below:
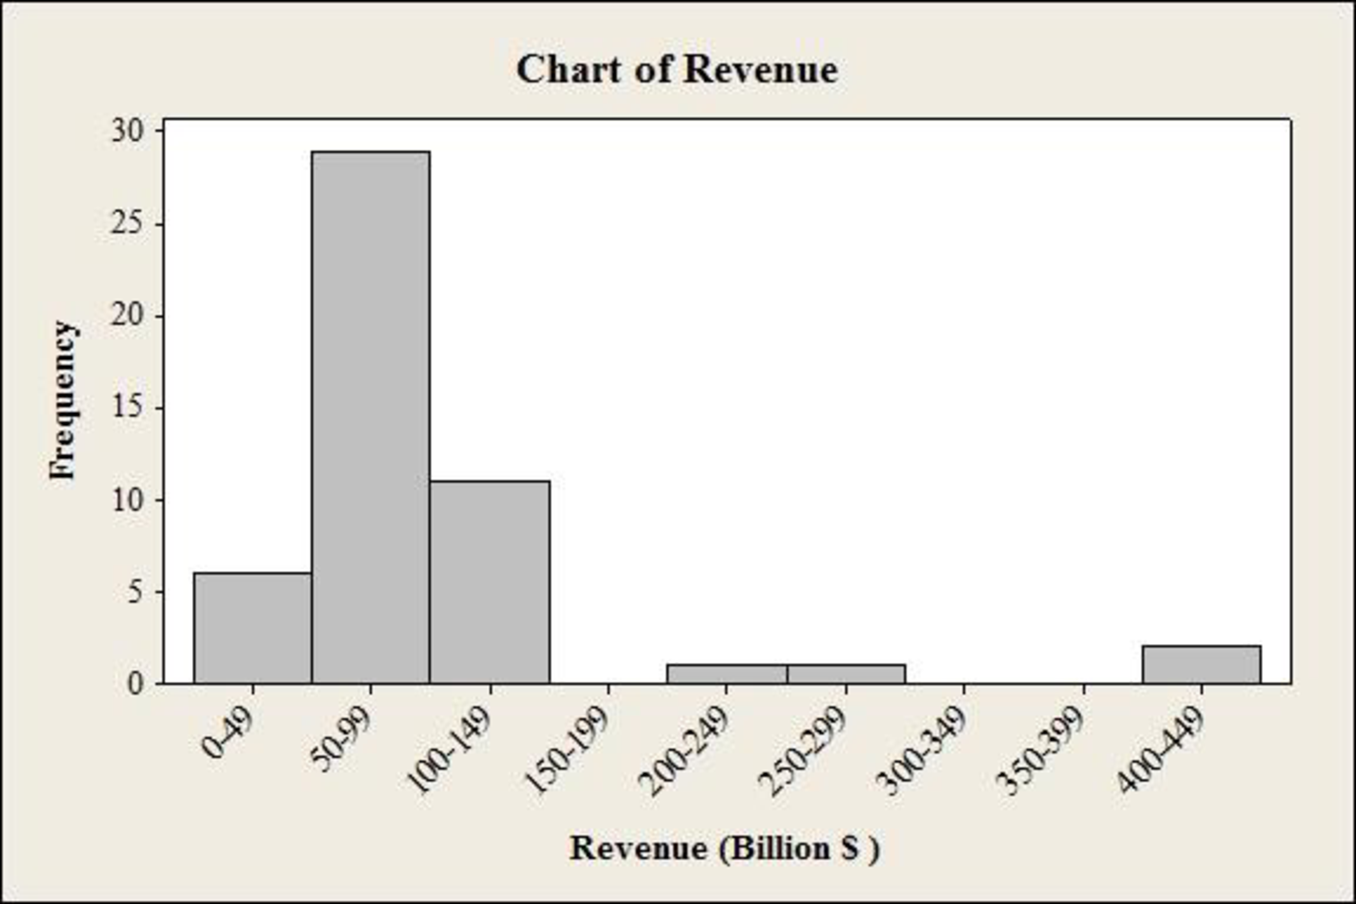
The histogram is skewed to the right.
Explanation of Solution
Calculation:
Software procedure:
Step by step procedure to draw the frequency histogram chart by using MINITAB software.
- Choose Graph > Histogram.
- Choose Simple, and then click OK.
- In Graph variables, enter the Revenue column of data.
- In scale on y-axis, make click on frequency.
- Click on ok.
Skewness:
The data is said to be skewed if there is lack of symmetry and values fall on one side that is, either left or right of the distribution.
Right skewed:
If the tail on the distribution is elongated towards the right, more over it attains its peak rapidly than its horizontal axis and then it is a right skewed distribution. It is also called positively skewed.
The distribution of revenue in the histogram has elongated tail towards right side. There are four corporations in the range 200 billion dollars to 449 billion dollars.
Therefore, the distribution of the histogram with revenue is skewed right.
g.
Find the largest corporation in America and find its annual revenue.
Answer to Problem 21E
Exxon-Mobil is the largest corporation in America and its annual revenue is 443 billion dollars.
Explanation of Solution
From the data set of 50 largest corporations, it is observed that the largest corporation in America is Exxon-Mobil and its annual revenue is 443 billion dollar.
The second largest corporation in America is walmart and its annual revenue is 406 billion dollar.
Moreover, the possibility of corporation that has annual revenues less than 150 billion dollars is approximately 92 percent and the remaining other corporations have annual revenues less than 300 billion dollars.
Want to see more full solutions like this?
Chapter 2 Solutions
STATISTICS F/BUSINESS+ECONOMICS-TEXT


 Glencoe Algebra 1, Student Edition, 9780079039897...AlgebraISBN:9780079039897Author:CarterPublisher:McGraw Hill