
Concept explainers
Videos
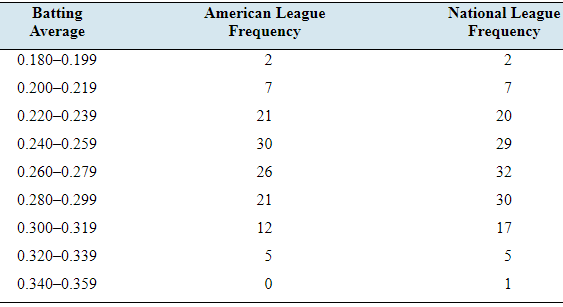
Batting average: The following frequency distribution presents the batting averages of Major League Baseball players in both the American League and the National League who had 300 or more plate appearances during a recent season.
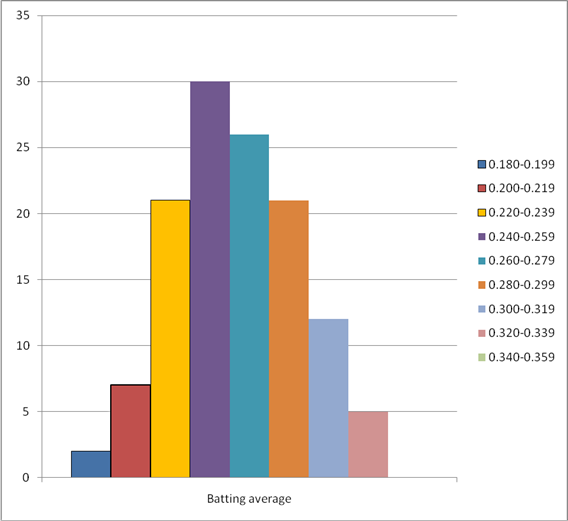
- Construct a frequency histogram for the American League.
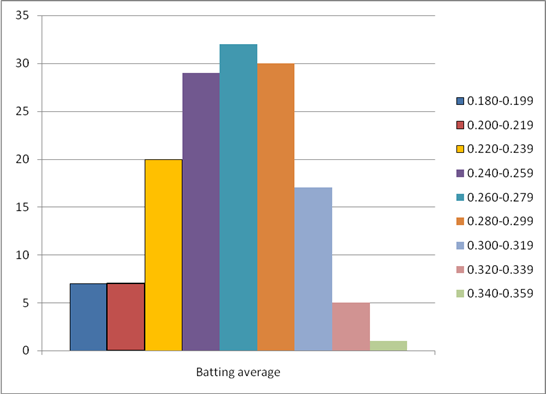
- Construct a frequency histogram for the National League.
- Construct a relative frequency distribution for the American League.
- Construct a relative frequency distribution for the National League.
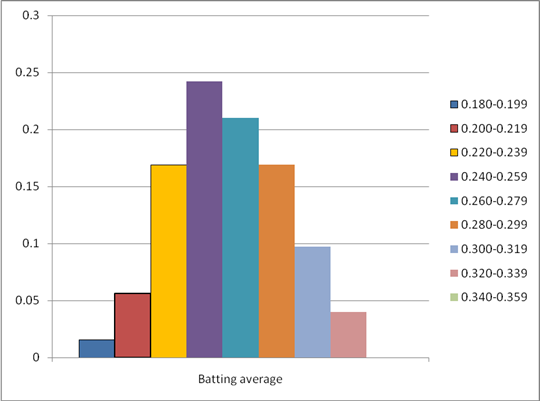
- Construct a relative frequency histogram for the American League.
- Construct a relative frequency histogram for the National League.
- What percentage of American League players had batting averages of 0.300 or more?
- What percentage of National League players had batting averages of 0.300 or more?
- Compare the relative frequency histograms. What is the main difference between the distributions of batting averages in the two leagues?
a.
To construct: A frequency histogram for American League.
Explanation of Solution
Given information:The following frequency distribution presents the batting averages of Major League Baseball players in both the American League and the National League who had 300 or more plate appearances during a recent season.
| Batting average | American LeagueFrequency | National LeagueFrequency |
| 0.180-0.199 | 2 | 2 |
| 0.200-0.219 | 7 | 7 |
| 0.220-0.239 | 21 | 20 |
| 0.240-0.259 | 30 | 29 |
| 0.260-0.279 | 26 | 32 |
| 0.280-0.299 | 21 | 30 |
| 0.300-0.319 | 12 | 17 |
| 0.320-0.339 | 5 | 5 |
| 0.340-0.359 | 0 | 1 |
Definition used: Histograms based on frequency distributions are called frequency histogram.
Solution:
The following frequency distribution presents the batting averages of Major League Baseball players in the American Leaguewho had 300 or more plate appearances during a recent season.
| Batting average | American LeagueFrequency |
| 0.180-0.199 | 2 |
| 0.200-0.219 | 7 |
| 0.220-0.239 | 21 |
| 0.240-0.259 | 30 |
| 0.260-0.279 | 26 |
| 0.280-0.299 | 21 |
| 0.300-0.319 | 12 |
| 0.320-0.339 | 5 |
| 0.340-0.359 | 0 |
The frequency histogram for American League is given by
b.
To construct: A frequency histogram for National League.
Explanation of Solution
Given information:The following frequency distribution presents the batting averages of Major League Baseball players in both the American League and the National League who had 300 or more plate appearances during a recent season.
| Batting average | American LeagueFrequency | National LeagueFrequency |
| 0.180-0.199 | 2 | 2 |
| 0.200-0.219 | 7 | 7 |
| 0.220-0.239 | 21 | 20 |
| 0.240-0.259 | 30 | 29 |
| 0.260-0.279 | 26 | 32 |
| 0.280-0.299 | 21 | 30 |
| 0.300-0.319 | 12 | 17 |
| 0.320-0.339 | 5 | 5 |
| 0.340-0.359 | 0 | 1 |
Definition used: Histograms based on frequency distributions are called frequency histogram.
Solution:
The following frequency distribution presents the batting averages of Major League Baseball players in the American Leaguewho had 300 or more plate appearances during a recent season.
| Batting average | National LeagueFrequency |
| 0.180-0.199 | 2 |
| 0.200-0.219 | 7 |
| 0.220-0.239 | 20 |
| 0.240-0.259 | 29 |
| 0.260-0.279 | 32 |
| 0.280-0.299 | 30 |
| 0.300-0.319 | 17 |
| 0.320-0.339 | 5 |
| 0.340-0.359 | 1 |
The frequency histogram for American League is given by
c.
To construct: A relative frequency distribution for American League.
Explanation of Solution
Given information:The following frequency distribution presents the batting averages of Major League Baseball players in both the American League and the National League who had 300 or more plate appearances during a recent season.
| Batting average | American LeagueFrequency | National LeagueFrequency |
| 0.180-0.199 | 2 | 2 |
| 0.200-0.219 | 7 | 7 |
| 0.220-0.239 | 21 | 20 |
| 0.240-0.259 | 30 | 29 |
| 0.260-0.279 | 26 | 32 |
| 0.280-0.299 | 21 | 30 |
| 0.300-0.319 | 12 | 17 |
| 0.320-0.339 | 5 | 5 |
| 0.340-0.359 | 0 | 1 |
Formula used:
Solution:
From the given table,
The sum of all frequency for American League is
The table of relative frequency is given by
| Batting average | American LeagueFrequency | American LeagueRelative frequency |
| 0.180-0.199 | 2 | |
| 0.200-0.219 | 7 | |
| 0.220-0.239 | 21 | |
| 0.240-0.259 | 30 | |
| 0.260-0.279 | 26 | |
| 0.280-0.299 | 21 | |
| 0.300-0.319 | 12 | |
| 0.320-0.339 | 5 | |
| 0.340-0.359 | 0 |
The relative frequency for the American League is given by
| Batting average | American LeagueRelative frequency |
| 0.180-0.199 | 0.016 |
| 0.200-0.219 | 0.056 |
| 0.220-0.239 | 0.169 |
| 0.240-0.259 | 0.242 |
| 0.260-0.279 | 0.210 |
| 0.280-0.299 | 0.169 |
| 0.300-0.319 | 0.097 |
| 0.320-0.339 | 0.040 |
| 0.340-0.359 | 0.000 |
d.
To construct: A relative frequency distribution for National League.
Explanation of Solution
Given information:The following frequency distribution presents the batting averages of Major League Baseball players in both the American League and the National League who had 300 or more plate appearances during a recent season.
| Batting average | American LeagueFrequency | National LeagueFrequency |
| 0.180-0.199 | 2 | 2 |
| 0.200-0.219 | 7 | 7 |
| 0.220-0.239 | 21 | 20 |
| 0.240-0.259 | 30 | 29 |
| 0.260-0.279 | 26 | 32 |
| 0.280-0.299 | 21 | 30 |
| 0.300-0.319 | 12 | 17 |
| 0.320-0.339 | 5 | 5 |
| 0.340-0.359 | 0 | 1 |
Formula used:
Solution:
From the given table,
The sum of all frequency for National League is
The table of relative frequency is given by
| Batting average | National LeagueFrequency | National LeagueRelative frequency |
| 0.180-0.199 | 2 | |
| 0.200-0.219 | 7 | |
| 0.220-0.239 | 20 | |
| 0.240-0.259 | 29 | |
| 0.260-0.279 | 32 | |
| 0.280-0.299 | 30 | |
| 0.300-0.319 | 17 | |
| 0.320-0.339 | 5 | |
| 0.340-0.359 | 1 |
The relative frequency for the NationalLeague is given by
| Batting average | National LeagueRelative frequency |
| 0.180-0.199 | 0.014 |
| 0.200-0.219 | 0.049 |
| 0.220-0.239 | 0.140 |
| 0.240-0.259 | 0.203 |
| 0.260-0.279 | 0.224 |
| 0.280-0.299 | 0.210 |
| 0.300-0.319 | 0.119 |
| 0.320-0.339 | 0.035 |
| 0.340-0.359 | 0.007 |
e.
To construct: A relative frequency histogram for American League.
Explanation of Solution
Given information:The following frequency distribution presents the batting averages of Major League Baseball players in both the American League and the National League who had 300 or more plate appearances during a recent season.
| Batting average | American LeagueFrequency | National LeagueFrequency |
| 0.180-0.199 | 2 | 2 |
| 0.200-0.219 | 7 | 7 |
| 0.220-0.239 | 21 | 20 |
| 0.240-0.259 | 30 | 29 |
| 0.260-0.279 | 26 | 32 |
| 0.280-0.299 | 21 | 30 |
| 0.300-0.319 | 12 | 17 |
| 0.320-0.339 | 5 | 5 |
| 0.340-0.359 | 0 | 1 |
Definition used: Histograms based on relative frequency distributions are called relative frequency histogram.
Solution:
| Batting average | American LeagueRelative frequency |
| 0.180-0.199 | 0.016 |
| 0.200-0.219 | 0.056 |
| 0.220-0.239 | 0.169 |
| 0.240-0.259 | 0.242 |
| 0.260-0.279 | 0.210 |
| 0.280-0.299 | 0.169 |
| 0.300-0.319 | 0.097 |
| 0.320-0.339 | 0.040 |
| 0.340-0.359 | 0.000 |
The relative frequency histogram for the given data is given by

f.
To construct: A relative frequency histogram for National League.
Explanation of Solution
Given information:The following frequency distribution presents the batting averages of Major League Baseball players in both the American League and the National League who had 300 or more plate appearances during a recent season.
| Batting average | American LeagueFrequency | National LeagueFrequency |
| 0.180-0.199 | 2 | 2 |
| 0.200-0.219 | 7 | 7 |
| 0.220-0.239 | 21 | 20 |
| 0.240-0.259 | 30 | 29 |
| 0.260-0.279 | 26 | 32 |
| 0.280-0.299 | 21 | 30 |
| 0.300-0.319 | 12 | 17 |
| 0.320-0.339 | 5 | 5 |
| 0.340-0.359 | 0 | 1 |
Definition used: Histograms based on relative frequency distributions are called relative frequency histogram.
Solution:
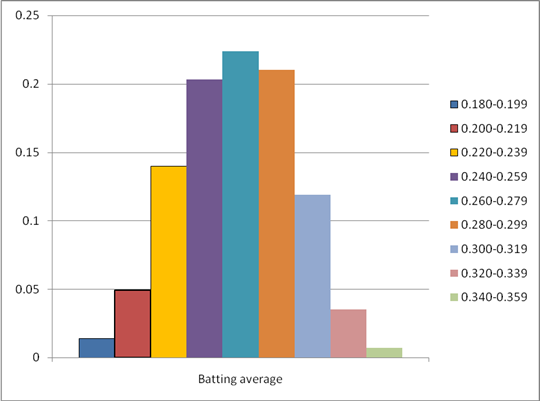
| Batting average | NationalLeagueRelative frequency |
| 0.180-0.199 | 0.014 |
| 0.200-0.219 | 0.049 |
| 0.220-0.239 | 0.140 |
| 0.240-0.259 | 0.203 |
| 0.260-0.279 | 0.224 |
| 0.280-0.299 | 0.210 |
| 0.300-0.319 | 0.119 |
| 0.320-0.339 | 0.035 |
| 0.340-0.359 | 0.007 |
The relative frequency histogram for the given data is given by

g.
To find: The percentage of American League players who had batting averages of 0.300 or more.
Answer to Problem 28E
The percentage of American League players who had batting averages of 0.300 or more is 13.7%.
Explanation of Solution
Given information:The following frequency distribution presents the batting averages of Major League Baseball players in both the American League and the National League who had 300 or more plate appearances during a recent season.
| Batting average | American LeagueFrequency | National LeagueFrequency |
| 0.180-0.199 | 2 | 2 |
| 0.200-0.219 | 7 | 7 |
| 0.220-0.239 | 21 | 20 |
| 0.240-0.259 | 30 | 29 |
| 0.260-0.279 | 26 | 32 |
| 0.280-0.299 | 21 | 30 |
| 0.300-0.319 | 12 | 17 |
| 0.320-0.339 | 5 | 5 |
| 0.340-0.359 | 0 | 1 |
Calculation:
The relative frequency for American League is given by
| Batting average | American LeagueRelative frequency |
| 0.180-0.199 | 0.016 |
| 0.200-0.219 | 0.056 |
| 0.220-0.239 | 0.169 |
| 0.240-0.259 | 0.242 |
| 0.260-0.279 | 0.210 |
| 0.280-0.299 | 0.169 |
| 0.300-0.319 | 0.097 |
| 0.320-0.339 | 0.040 |
| 0.340-0.359 | 0.000 |
From the above data, the relative frequencies of batting averages of 0.300 or more are 0.097, 0.040 and 0.000
The sum of all the above relative frequencies is
Then, its percentage is 13.7%
Hence, the percentage of American League players who had batting averages of 0.300 or more is 13.7%.
h.
To find: The percentage of National League players who had batting averages of 0.300 or more.
Answer to Problem 28E
The percentage of National League players who had batting averages of 0.300 or more is 16.1%.
Explanation of Solution
Given information:The following frequency distribution presents the batting averages of Major League Baseball players in both the American League and the National League who had 300 or more plate appearances during a recent season.
| Batting average | American LeagueFrequency | National LeagueFrequency |
| 0.180-0.199 | 2 | 2 |
| 0.200-0.219 | 7 | 7 |
| 0.220-0.239 | 21 | 20 |
| 0.240-0.259 | 30 | 29 |
| 0.260-0.279 | 26 | 32 |
| 0.280-0.299 | 21 | 30 |
| 0.300-0.319 | 12 | 17 |
| 0.320-0.339 | 5 | 5 |
| 0.340-0.359 | 0 | 1 |
Calculation:
The relative frequency for National League is given by
| Batting average | NationalLeagueRelative frequency |
| 0.180-0.199 | 0.014 |
| 0.200-0.219 | 0.049 |
| 0.220-0.239 | 0.140 |
| 0.240-0.259 | 0.203 |
| 0.260-0.279 | 0.224 |
| 0.280-0.299 | 0.210 |
| 0.300-0.319 | 0.119 |
| 0.320-0.339 | 0.035 |
| 0.340-0.359 | 0.007 |
From the above data, the relative frequencies of batting averages of 0.300 or more are 0.119, 0.035 and 0.007.
The sum of all the above relative frequencies is
Then, its percentage is 16.1%
Hence, the percentage of National League players who had batting averages of 0.300 or more is 16.1%.
i.
To find: The percentage of players who had batting averages less than 0.220.
Answer to Problem 28E
The batting averages tend to be a bit higher in the National League.
Explanation of Solution
Given information:The following frequency distribution presents the batting averages of Major League Baseball players in both the American League and the National League who had 300 or more plate appearances during a recent season.
| Batting average | American LeagueFrequency | National LeagueFrequency |
| 0.180-0.199 | 2 | 7 |
| 0.200-0.219 | 7 | 7 |
| 0.220-0.239 | 21 | 20 |
| 0.240-0.259 | 30 | 29 |
| 0.260-0.279 | 26 | 32 |
| 0.280-0.299 | 21 | 30 |
| 0.300-0.319 | 12 | 17 |
| 0.320-0.339 | 5 | 5 |
| 0.340-0.359 | 0 | 1 |
Solution:
The relative frequency histogram for American League is given by
The relative frequency histogram for the National League is given by
From the above two histograms, we can see that the relative frequency for National league is bit higher than the National League.
Hence, the batting averages tend to be a bit higher in the National League.
Want to see more full solutions like this?
Chapter 2 Solutions
Elementary Statistics ( 3rd International Edition ) Isbn:9781260092561
Additional Math Textbook Solutions
Statistical Reasoning for Everyday Life (5th Edition)
The Practice of Statistics for AP - 4th Edition
Introductory Statistics (2nd Edition)
Statistics for Business and Economics (13th Edition)


 Glencoe Algebra 1, Student Edition, 9780079039897...AlgebraISBN:9780079039897Author:CarterPublisher:McGraw Hill
 Holt Mcdougal Larson Pre-algebra: Student Edition...AlgebraISBN:9780547587776Author:HOLT MCDOUGALPublisher:HOLT MCDOUGAL
 Big Ideas Math A Bridge To Success Algebra 1: Stu...AlgebraISBN:9781680331141Author:HOUGHTON MIFFLIN HARCOURTPublisher:Houghton Mifflin Harcourt