

Q: EXPLAIN RELATIONSHIP BETWEEN THE MARGINAL REVENUE AND THE AVERAGE REVENUE.
A: According to the given question Marginal revenue in simple words we can say that is the introduction…
Q: In pure competition, the marginal revenue of a firm always equals a. total revenue b. average total…
A: In perfectly competitive market, a firm has perfectly elastic demand curve which means the firm can…
Q: marginal profit is $30 and marginal revenue is $84 Calculate marginal cost
A: The given information is as follows:- Marginal profit= $30 Marginal revenue = $84 We need to find…
Q: With the aid of a diagram explain normal profit
A: Normal profit is a profit that implies the average revenue from selling equals the average cost .…
Q: Gymnast Clothing manufactures expensive hockey jerseys for sale to college bookstores in runs of up…
A: a. Revenue function is 110x
Q: Description Given the following graph, please label the curves where asked and answer the…
A: Here ,we have to find profit - maximizing level of output.
Q: Tammy quit her job as a math teacher making $70,000 per year to start her own online business. The…
A: (Q) Tammy quit her job as a math teacher making $70,000 per year to start her own online business.…
Q: Explain how a firm chooses a level of output to maximise profit
A: The profit maximization refers to a situation where the firm is earning the maximum possible profits…
Q: Calculate Kenji's marginal revenue and marginal cost for the first seven teddy bears he produces and…
A: Marginal revenue is calculated as the ratio of change in total revenue to change in quantity.…
Q: If marginal profit is negative what information can you infer about marginal cost and marginal…
A: Marginal profit is given as :- Marginal profit = Marginal revenue - Marginal cost It's given that…
Q: Use the table to compute the marginal revenue and marginal cost
A: Marginal revenue is given as the additional revenue generated by producing one more unit of a good.…
Q: According to the graph below, the firm doesn't make a profit when the quantity exceeds what value?…
A: Profit is the difference between the total revenue and and total cost.
Q: Draw a diagram illustrating the case of a perfectly competitive business firm making a profit. label…
A: A market is a place where the buyers and the sellers interact with each other and the exchange of…
Q: Consider the following information about a business Rodriguez opened last year: price = $5; quantity…
A: Profits are calculated by taking the difference between the total revenue that is earned and the…
Q: The graph below summarizes the demand and costs for a firm that operates in a perfectly competitive…
A: Answer to the question is as follows :
Q: By looking of this graph, what can you say about the market power of this firm? Is it a perfect…
A: Since we only answer up to 3 sub-parts, we’ll answer the first 3. Please resubmit the question and…
Q: Calculate Economic profit and Accounting profit from the figures given below for ABC Company.…
A: Companies, such as ABC company, maintain a record of all the business transactions to analyze…
Q: Determine the output level that will maximize economic profit.
A: Economic profit is the difference between the sum of explicit and opportunity costs from the revenue…
Q: Hannah has a small business making clothing alterations. Which of the following products would…
A: Hannah has a small business that makes clothes adjustments, according to the question. Thread is the…
Q: Discuss the concept of marginal revenue and average total cost using the example of a particular…
A: Marginal revenue is the additional revenue to the total revenue when one more unit of output is…
Q: The inverse demand for an app is P = PD (Q) = 30-0,4. Q. The inverse demand function indicated the…
A: Given function P = P^d(Q) = 30 - 0.4Q Also, given fixed cost = 420 and marginal cost = 2 Thus, here…
Q: Suppose Poornima runs a small business that manufactures teddy bears. Assume that the market for…
A: Q TC TR Profit MC MR 0 20 0 -20 - - 1 40 25 -15 20 25 2 50 50 0 10 25 3 55 75 20 5 25 4 65…
Q: P ($) TR ($) MR ($) TC АTC ($) MC ($) ($) Y Average Total Output Price Marginal Total Total Revenue…
A: The total cost incurred by a firm operating in a market includes fixed costs and variable costs.…
Q: Using the figure above, what is profit/loss for the firm?
A: In the case of a profit-maximizing firm, the optimal point of production is where the price is equal…
Q: The graph below represents sales per week of ABC Inc. Ltd, a monopoly multinational enterprise that…
A: Monopoly is a structure of market in which there is only one firm producing commodity and has market…
Q: Consider the following information about a business Rodriguez opened last year: price = $5; quantity…
A: Accounting profit is the net income created by a company. Accounting benefit is a company's net…
Q: . Which is the other name that is given to the average revenue curve?
A: The average revenue curve represents the revenue per unit for different quantities of output.
Q: Taylor used to work as a yoga instructor at the local gym earning $27,000 a year. Taylor quit that…
A: Accounting profit is the net income for a company, which is revenue minus expenses. Economic profit…
Q: The table below shows the information on Ilham Bakery. Item Amount Revenue in operating the…
A: In a market, a firm's economic profit is the difference between the total revenue and the total cost…
Q: the average variable cost curve. the marginal cost curve. the average fixed cost curve. the marginal…
A: A natural monopoly firm experience economies of scale, i.e., a decrease in ATC as output increases.…
Q: Calculate Economic profit and Accounting profit from the figures given below for ABC Company. Total…
A: Answer: Introduction: Accounting profit: Accounting profit refers to the difference between total…
Q: How do you calculate marginal cost and marginal revenue?
A: Marginal revenue: Marginal revenue refers to the additional revenue that made by selling of one…
Q: Draw a graph to show the breakeven point, shutdown point and supply curve.
A: Answer: Break-even point: break-even point is the point where the total revenue is equal to the…
Q: Calculate Marginal profit given that marginal revenue is two times that of marginal cost
A: The given information is as follows:- Marginal revenue is two times that of total cost i.e MR = 2 MC…
Q: Graph the market demand curve, the marginal revenue curve, and the marginal cost curve. Label the…
A: Demand: P = 45 - (Q/60) TR = PQ = 45Q - (Q2/60) MR = dTR/dQ = 45 - (Q/30) MC = 0 From demand: When Q…
Q: Match the words from the list below to complete the following statement A firm will maximise by…
A: Marginal cost refers to the total costs which arise when the the quantity produced increases by one…
Q: Complete the following table by computing the total profit (the research lab's economic profit and…
A: Given, the researcher could uses different method of production that involve recycling water, the…
Q: Complete the table above. What is the profit-maximizing output for this firm? a) 3 units b) 4 units…
A: Costs Revenues Quantity Produced Total Cost $ Marginal Cost Quantity Produced Price $ Total…
Q: Distinguish clearly between Marginal Revenue and Marginal Costs using suitable examples.
A: Marginal revenue is defined as the additional revenue after selling one more unit of output.
Q: Comment why is this point significant analytically.
A: Marginal cost is defined as the change in total cost that results from the production of an…
Use the table in the image below to answer this question
Use the information to plot the demand, marginal revenue and marginal cost
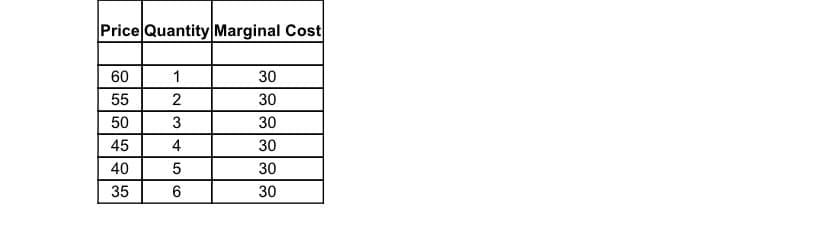

Step by step
Solved in 2 steps with 1 images


- Explain the ethical and social implications of “offshoring”. Consider the issue from the perspective of both U.S employees and foreign employees. Consider the issue from the perspective of companies hiring foreign workers.Total price: $307.32 Tax or tip rate: 20% Enter the correct answerA contractor of a fast food giant failed to deliver the expected output of an inventory system upgrade. This resulted in more than 70 branches closing due to inventory problems. It compromised the sales for the month. What do you think were the potential opportunities opened up to other player in the fast food industry?
- Carissa buys a pair of shoes that was priced $600. There is a 9% sales tax in her state. Fortunately, it was 35% off! So she only paid $______ Question Help: Message instructor Post to forum Submit Question. Hand written solutions are strictly prohibitedplease assist I am lostCasinos in the US wanted to purchase decks of cards made in Mexico. It costs less than half the price paid to US suppliers. However, the price is based on the product outside the Mexican manufacturing doors. The US firm must find a way to transport the cards to the US. This is a problem given the current US regulations on transportation between Mexico and the US and the strong truck drivers union. In this case, casinos are experiencing: Underinvestment in Mexico. Language and cultural barriers in management. Limited SI in Mexico. High transaction costs and possible hold up problems.
- can you help me with this question Note:- Do not provide handwritten solution. Maintain accuracy and quality in your answer. Take care of plagiarism. Answer completely. You will get up vote for sure.A beer bottling plant could produce 99 bottles of beer for $70 or 100 bottles of beer for $82. The marginal cost of the 100th bottle of beer Group of answer choices $12 $.82 $82 $70Profit = 2203.4*Demand -705030 Profit(1000)
- The ______ participating in collective bargaining process must be strong, convincing, democratic and enlightened Select one: a. Employers b. Officials c. Union d. EmployeesUpgrading an Organization’s ComputersYour organization earns $50 million in annual sales, has 500 employees, andplans to acquire 250 new mobile computers this year along with another 250next year. The goal is to issue every employee a company-owned computer,which they can use at work and at home. The computers will be loaded withantivirus software and productivity software to meet each employee’s business needs. Your organization has decided it will purchase the computersfrom the same manufacturer to obtain a quantity purchase discount. To theextent possible, the goal is to have the same hardware and software foreveryone to simplify the troubleshooting and support of the computers. Thechief financial officer has asked you to lead a project team to define users’computer hardware needs and recommend the most cost-effective solutionfor meeting those needs. Critical Thinking Questions1. Who else (role, department) and how many people would you select to bea member of the team? How would…Answer Box: -5,0,3,5,10,30,45,50, continue to produce, shut down, Other