
Concept explainers
(a)
Interpretation:
The potential of the electrode with respect to a Ag/AgCl(sat’d) reference electrode after addition of different volumes of Cerium(IV) should be calculated.
Concept introduction:
Nernst equation gives the cell potential under non-standard conditions.
E − cell potential
E0 − standard cell potential
R − universal gas constant
T − temperature in Kelvin
n − number of electrons transferred
F − Faraday constant
Q − Reaction quotient
Answer to Problem 23.24QAP
| Volume of Ce4+, mL | Ecell, V |
| 5.00 | 0.712754 |
| 10.00 | 0.723179 |
| 15.00 | 0.730108 |
| 20.00 | 0.735787 |
| 24.00 | 0.739971 |
| 24.90 | 0.740897 |
| 25.00 | 0.741 |
| 40.00 | 0.75882 |
| 45.00 | 0.769244 |
| 49.00 | 0.791022 |
| 49.50 | 0.800055 |
| 49.60 | 0.802945 |
| 49.70 | 0.806663 |
| 49.80 | 0.811887 |
| 49.90 | 0.820784 |
| 49.95 | 0.829627 |
| 49.99 | 0.849708 |
| 50.00 | 0.907667 |
| 50.01 | 1.020361 |
| 50.05 | 1.063076 |
| 50.10 | 1.081059 |
| 50.20 | 1.098961 |
| 50.30 | 1.109413 |
| 50.40 | 1.116822 |
| 50.50 | 1.122568 |
| 51.00 | 1.140405 |
| 55.00 | 1.181796 |
| 60.00 | 1.199619 |
| 75.00 | 1.223178 |
| 90.00 | 1.235262 |
Explanation of Solution
The electrode potentials for half cell reactions are as follows:
The overall reaction will be:
Overall reaction:
The system is at equilibrium all time. So, the electrode potential for the two half-cell reactions are always equal
(1) + (2) x 2
Since, the hydrogen ion concentration is at 1.00 M throughout the titration,one can simplify the above equation.
At equivalence point,
So,
Potential before the equivalence point can be determined by applying the Nernst equation for HNO2/NO3- half-cell reaction. And potential after the equivalence point can be determined by applying Nernst equation for the Ce4+/Ce3+ half-cell reaction.
Initial concentration of HNO2 =
Volume of Ce4+ spent at the equivalence point =
When 5.00 mL of Ce4+ solution is added,
Concentration of NO3- =
=
Concentration of HNO2 left =
=
When 50.01 mL of Ce4+ added
Concentration of Ce4+ =
=
Concentration of Ce3+ =
=
likewise, one can calculate the concentrations of the species when other volumes of Ce4+ added. And then the electrode potential can be calculated. The potential of the indicator electrode with respect to a Ag/AgCl reference electrode can be calculated by subtracting the Ag/AgCl standard electrode potential from the electrode potential for the redox reaction calculated.
| Volume of Ce4+, mL | [NO3-] | [HNO2] | [Ce3+] | [Ce4+] | Ecell, V |
| 5.00 | 0.0025 | 0.0225 | 0.712754 | ||
| 10.00 | 0.004705882 | 0.018824 | 0.723179 | ||
| 15.00 | 0.006666667 | 0.015556 | 0.730108 | ||
| 20.00 | 0.008421053 | 0.012632 | 0.735787 | ||
| 24.00 | 0.00969697 | 0.010505 | 0.739971 | ||
| 24.90 | 0.00996997 | 0.01005 | 0.740897 | ||
| 25.00 | 0.01 | 0.01 | 0.741 | ||
| 40.00 | 0.013913043 | 0.003478 | 0.75882 | ||
| 45.00 | 0.015 | 0.001667 | 0.769244 | ||
| 49.00 | 0.015806452 | 0.000323 | 0.791022 | ||
| 49.50 | 0.015903614 | 0.000161 | 0.800055 | ||
| 49.60 | 0.015922953 | 0.000129 | 0.802945 | ||
| 49.70 | 0.015942261 | 9.64E-05 | 0.806663 | ||
| 49.80 | 0.015961538 | 6.43E-05 | 0.811887 | ||
| 49.90 | 0.015980785 | 3.22E-05 | 0.820784 | ||
| 49.95 | 0.015990396 | 1.62E-05 | 0.829627 | ||
| 49.99 | 0.01599808 | 3.4E-06 | 0.849708 | ||
| 50.00 | 0.907667 | ||||
| 50.01 | 0.031998 | 5.99952E-06 | 1.020361 | ||
| 50.05 | 0.031988 | 3.15874E-05 | 1.063076 | ||
| 50.10 | 0.031975 | 6.35492E-05 | 1.081059 | ||
| 50.20 | 0.031949 | 0.000127396 | 1.098961 | ||
| 50.30 | 0.031924 | 0.000191141 | 1.109413 | ||
| 50.40 | 0.031898 | 0.000254785 | 1.116822 | ||
| 50.50 | 0.031873 | 0.000318327 | 1.122568 | ||
| 51.00 | 0.031746 | 0.000634524 | 1.140405 | ||
| 55.00 | 0.03077 | 0.003076538 | 1.181796 | ||
| 60.00 | 0.02963 | 0.005925556 | 1.199619 | ||
| 75.00 | 0.026667 | 0.013333 | 1.223178 | ||
| 90.00 | 0.024243 | 0.019393636 | 1.235262 |
(b)
Interpretation:
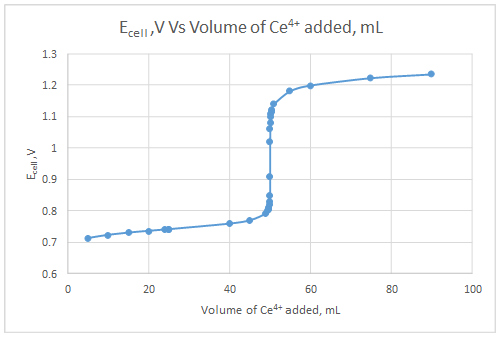
A titration curve should be constructed
Concept introduction:
Potentiometric titration is similar to direct redox titrations but in potentiometric titrations no indicator is used. Instead, the potential is measured during the titration to obtain the equivalence point.
Answer to Problem 23.24QAP
Explanation of Solution
The dependent variable is the indicator electrode potential and the independent variable is volume of Ce4+ solution added.

(c)
Interpretation:
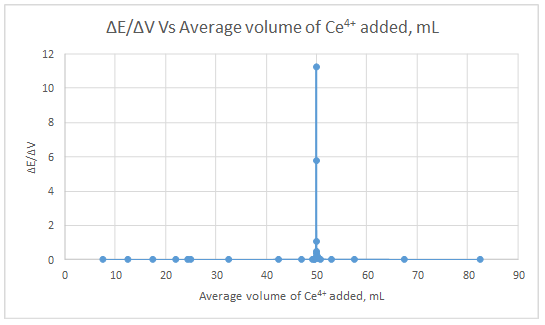
A first and second derivative curve for the data should be generated.
Concept introduction:
The first derivative curve of the potentiometric titration is plotted between
Answer to Problem 23.24QAP
First derivative curve:
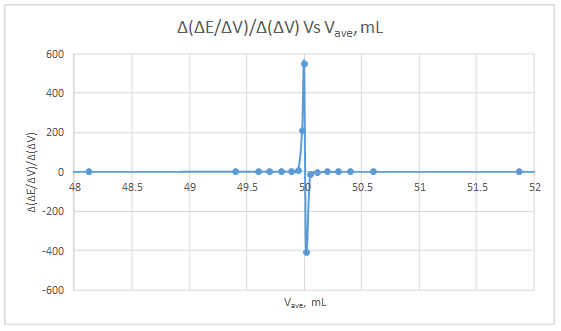
Second derivative curve:
Explanation of Solution
| ΔE | ΔV | ΔE/ΔV | Vave | Δ(ΔE/ΔV) | Δ(ΔV) | Δ(ΔE/ΔV)/Δ(ΔV) | Vave |
| 0.010425 | 5 | 0.002085 | 7.5 | ||||
| 0.006929 | 5 | 0.001386 | 12.5 | -0.0006992 | 5 | -0.00013984 | 10 |
| 0.005679 | 5 | 0.001136 | 17.5 | -0.00025 | 5 | -5E-05 | 15 |
| 0.004184 | 4 | 0.001046 | 22 | -8.98E-05 | 4.5 | -1.99556E-05 | 19.75 |
| 0.000926 | 0.9 | 0.001029 | 24.45 | -1.71111E-05 | 2.45 | -6.98413E-06 | 23.225 |
| 0.000103 | 0.1 | 0.00103 | 24.95 | 1.11111E-06 | 0.5 | 2.22222E-06 | 24.7 |
| 0.01782 | 15 | 0.001188 | 32.5 | 0.000158 | 7.55 | 2.09272E-05 | 28.725 |
| 0.010424 | 5 | 0.002085 | 42.5 | 0.0008968 | 10 | 8.968E-05 | 37.5 |
| 0.021778 | 4 | 0.005444 | 47 | 0.0033597 | 4.5 | 0.0007466 | 44.75 |
| 0.009033 | 0.5 | 0.018066 | 49.25 | 0.0126215 | 2.25 | 0.005609556 | 48.125 |
| 0.00289 | 0.1 | 0.0289 | 49.55 | 0.010834 | 0.3 | 0.036113333 | 49.4 |
| 0.003718 | 0.1 | 0.03718 | 49.65 | 0.00828 | 0.1 | 0.0828 | 49.6 |
| 0.005224 | 0.1 | 0.05224 | 49.75 | 0.01506 | 0.1 | 0.1506 | 49.7 |
| 0.008897 | 0.1 | 0.08897 | 49.85 | 0.03673 | 0.1 | 0.3673 | 49.8 |
| 0.008843 | 0.05 | 0.17686 | 49.925 | 0.08789 | 0.075 | 1.171866667 | 49.8875 |
| 0.020081 | 0.04 | 0.502025 | 49.97 | 0.325165 | 0.045 | 7.225888889 | 49.9475 |
| 0.057959 | 0.01 | 5.7959 | 49.995 | 5.293875 | 0.025 | 211.755 | 49.9825 |
| 0.112694 | 0.01 | 11.2694 | 50.005 | 5.4735 | 0.01 | 547.35 | 50 |
| 0.042715 | 0.04 | 1.067875 | 50.03 | -10.201525 | 0.025 | -408.061 | 50.0175 |
| 0.017983 | 0.05 | 0.35966 | 50.075 | -0.708215 | 0.045 | -15.73811111 | 50.0525 |
| 0.017902 | 0.1 | 0.17902 | 50.15 | -0.18064 | 0.075 | -2.408533333 | 50.1125 |
| 0.010452 | 0.1 | 0.10452 | 50.25 | -0.0745 | 0.1 | -0.745 | 50.2 |
| 0.007409 | 0.1 | 0.07409 | 50.35 | -0.03043 | 0.1 | -0.3043 | 50.3 |
| 0.005746 | 0.1 | 0.05746 | 50.45 | -0.01663 | 0.1 | -0.1663 | 50.4 |
| 0.017837 | 0.5 | 0.035674 | 50.75 | -0.021786 | 0.3 | -0.07262 | 50.6 |
| 0.041391 | 4 | 0.010348 | 53 | -0.02532625 | 2.25 | -0.011256111 | 51.875 |
| 0.017823 | 5 | 0.003565 | 57.5 | -0.00678315 | 4.5 | -0.001507367 | 55.25 |
| 0.023559 | 15 | 0.001571 | 67.5 | -0.001994 | 10 | -0.0001994 | 62.5 |
| 0.012084 | 15 | 0.000806 | 82.5 | -0.000765 | 15 | -5.1E-05 | 75 |
First derivative curve:

Second derivative curve:

The volume at which the second-derivative curve cross zero correspond to the theoretical equivalence point. Theoretical equivalence point is 50.00 mL.At the maximum of the peak in the first derivative curve has a slope of zero. So, in the second derivative curve crosses the x axis at the point, corresponding to the equivalence point.
Want to see more full solutions like this?
Chapter 23 Solutions
Principles of Instrumental Analysis


- A 40.00-mL aliquot of 0.05000 M HNO2 is diluted to 75.00 mL and titrated with 0.0800 M Ce4+. The pH of the solution is maintained at 1.00 throughout the titration; the formal potential of the cerium system is 1.44V a. Calculate the potential of the indicator electrode with respect to a saturated calomel reference electrode after the addition of 5.00, 10.00, 15.00, 25.00, 40.00, 49.00, 49.50, 49.60, 49.70, 49.80, 49.90, 49.95, 49.99, 50.00, 50.01, 50.05, 50.10, 50.20, 50.30, 50.40, 50.50, 51.00, 60.00, 75.00 and 90.00 mL of Cerium (IV). b. Draw a titration curve for these data. c. Generate a first- and second-derivative curve for these data. Does the volume at which the second-derivative curve crosses zero correspond to the theoretical equivalence point? Why or why not?arrow_forwarda) Define the term pH. Which electrode do you use? Draw a scheme and describe theprinciple of pH measurement. Express the limitations of the electrode used.b) To discuss following each titration of a solution with a strong base and draw each titrationcurvesi) 0.1 M H2SO4 (first acidty is very strong, K2= 1.2 10-2arrow_forwardA titration of 50.0 mL of 0.10 M Sn2+ with 0.2 M Fe3+ in 1 M HCl to give Fe2+ and Sn4+ using Pt and calomel electrodes. Assuming the standard potential for Sn2+/Sn4+ = 0.139V ; calomel, 0.241 V; Fe2+/Fe3+ = 0.732 V. This my cathode reaction: Fe3+ (aq) + 1 electron <-> Fe2+(s) and anode reaction: Sn2+(s) <-> Sn4+(aq) + 2 electrons. How will I write my Nernst equation for the cell voltage for the oxidation reaction?arrow_forward
- A 100.0 mL100.0 mL solution of 0.0200 M Fe3+0.0200 M Fe3+ in 1 M HClO41 M HClO4 is titrated with 0.100 M Cu+0.100 M Cu+, resulting in the formation of Fe2+Fe2+ and Cu2+Cu2+. A PtPt indicator electrode and a saturated Ag∣∣AgClAg|AgCl electrode are used to monitor the titration. Write the balanced titration reaction. titration reaction: Fe3++Cu+⟶Fe2++Cu2+Fe3++Cu+⟶Fe2++Cu2+ Complete the two half‑reactions that occur at the PtPt indicator electrode. Write the half‑reactions as reductions. half‑reaction: ?∘=0.161 V half‑reaction: ?∘=0.767 V Select the two equations that can be used to determine the cell voltage at different points in the titration. ?E of the Ag∣∣AgClAg|AgClelectrode is 0.197 V.0.197 V. ?=0.767 V−0.05916×log([Cu2+][Cu+])−0.197 V E=0.767 V−0.05916×log([Cu2+][Cu+])−0.197 V ?=0.767 V−0.05916×log([Fe3+][Fe2+])−0.197 V E=0.767 V−0.05916×log([Fe3+][Fe2+])−0.197 V ?=0.767 V−0.05916×log([Cu+][Cu2+])−0.197 V E=0.767…arrow_forwardA titration of 50.0 mL of 0.10 M Sn2+ with 0.2 M Fe3+ in 1 M HCl to give Fe2+ and Sn4+ using Pt and calomel electrodes. Assuming the standard potential for Sn2+/Sn4+ = 0.139V ; calomel, 0.241 V; Fe2+/Fe3+ = 0.732 V. Calculate the voltage (E) at 25 ml, 50 ml, and 70 ml.arrow_forwardThe selectivity coefficient of the fluoride ion-selective electrode is kF-,OH- = 0,15. How does the electrode potential of 1.4 x 10⁻⁵ M F- ions at pH 5.5 change to pH 11.0 ? ( aF- = [F-] dilute solution is considered).arrow_forward
- After measuring the pH of 0.20 M NaOH, the pH of 0.10 M Acetic Acid was immediately measured without washing the pH electrode. Which of the following describes the effect on the measurement of pH of CH3COOH? A. Traces of NaOH will react with CH3COOH, and will result in an increase of pH. B. Traces of NaOH will be detected as acetic acid and will result in the decrease in measured pH. C. The CH3COOH solution will be diluted with NaOH causing an increase in pH. D. There will be no effect since the pH meter is not sensitive trace amounts of acids or bases.arrow_forwardExplain the principle behind the working of an ion selective electrodearrow_forwardA 0.2g sample of toothpaste containing fluoride was treated with 50 cm3 of a suitable buffer solution and diluted to 100 cm3. Using a fluoride ion-selective electrode, a 25.00 cm3 aliquot of this solution gave cell potentials of –155.3 mV before and –176.2 mV after spiking with 0.1 cm3 of a 0.5 mg/cm3 fluoride standard. Calculate the pF– corresponding to each cell potential and the percentage by weight of fluoride in the toothpaste.arrow_forward
- Consider the titration of 100.0 mL of 0.010 0 M Ce4+ in 1 M HClO4 with 0.040 0 M Cu+ to give Ce3+ and Cu2+. Calculate the potential of the indicator electrode after adding 24.5 mL of Cu+.arrow_forwardAt what pH will hydrogen electrode at 298 K show an electrode potential of-0.118 V, when Hydrogen gas is bubbled at 1 atm pressure ?arrow_forwardCalculate the potential in the solution (vs. NHE) in the titration of 50.0 mL of 0.100 M Fe2+in 1.00 M HClO4 with 0.0167 M Cr2O7 2− at 10, 25, 50 and 60 mL titrant added.arrow_forward
 Principles of Instrumental AnalysisChemistryISBN:9781305577213Author:Douglas A. Skoog, F. James Holler, Stanley R. CrouchPublisher:Cengage Learning