
STATISTICS F/BUSINESS+ECONOMICS-TEXT
13th Edition
ISBN: 9781305881884
Author: Anderson
Publisher: CENGAGE L
expand_more
expand_more
format_list_bulleted
Videos
Textbook Question
Chapter 2.3, Problem 29E
The Daytona 500 is a 500-mile automobile race held annually at the Daytona International Speedway in Daytona beach, Florida. The following crosstabulation shows the automobile make by average speed of the 25 winners from 1988 to 2012 (The 2013 world Almanac).
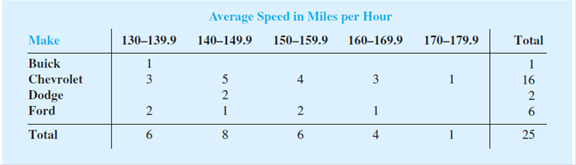
- a. Compute the row percentages.
- b. What percentage of winners driving a Chevrolet won with an average speed of at least 150 miles per hour?
- c. Compute the column percentages.
- d. What percentage of winning average speeds 160–169.9 miles per hour were Chevrolets?
Expert Solution & Answer

Trending nowThis is a popular solution!

Students have asked these similar questions
The numbers of students who passed or failed Professors Roth and Ahmadi’s courses last semester are given below.
Roth
Ahmadi
Total
Passed
258
172
430
Failed
45
25
70
Total
303
197
500
Based on table 3, compute the column percentages.
The International League of Triple-A minor league baseball consists of 14 teams organized into three divisions: North, South, and West. Suppose the following data show the average attendance for the 14 teams in the International League. Also shown are the teams' records; W denotes the number of games won, L denotes the number of games lost, and PCT is the proportion of games played that were won.
Team Name
Division
W
L
PCT
Attendance
Buffalo Bisons
North
66
77
0.462
8,813
Lehigh Valley IronPigs
North
55
89
0.382
8,479
Pawtucket Red Sox
North
85
58
0.594
9,099
Rochester Red Wings
North
74
70
0.514
6,917
Scranton-Wilkes Barre Yankees
North
88
56
0.611
7,149
Syracuse Chiefs
North
69
73
0.486
5,766
Charlotte Knights
South
63
78
0.447
4,524
Durham Bulls
South
74
70
0.514
6,994
Norfolk Tides
South
64
78
0.451
6,283
Richmond Braves
South
63
78
0.447
4,451
Columbus Clippers
West
69
73
0.486
7,796
Indianapolis Indians
West
68
76
0.472
8,535
Louisville Bats
West
88…
The International League of Triple-A minor league baseball consists of 14 teams organized into three divisions: North, South, and West. The following data show the average attendance for the 14 teams in the International League. Also shown are the teams' records; W denotes the number of games won, L denotes the number of games lost, and PCT is the proportion of games played that were won.
Chapter 2 Solutions
STATISTICS F/BUSINESS+ECONOMICS-TEXT
Ch. 2.1 - Methods 1. The response to a question has three...Ch. 2.1 - A partial relative frequency distribution is...Ch. 2.1 - A questionnaire provides 58 Yes, 42 No, and 20...Ch. 2.1 - for the 20102011 viewing season, the top five...Ch. 2.1 - In alphabetical order, the six most common last...Ch. 2.1 - Nielsen Media Research provided the list of the 25...Ch. 2.1 - The Canmark Research Center Airport Customer...Ch. 2.1 - Data for a sample of 55 members of the Baseball...Ch. 2.1 - Nearly 1.8 million bachelors degrees and over...Ch. 2.1 - VirtualTourist provides ratings for hotels...
Ch. 2.2 - Consider the following data. a. Develop a...Ch. 2.2 - Consider the following frequency distribution....Ch. 2.2 - Construct a histogram for the data in exercise 12.Ch. 2.2 - Consider the following data. a. Construct a dot...Ch. 2.2 - Construct a stem-and-leaf display for the...Ch. 2.2 - Construct a stem-and-leaf display for the...Ch. 2.2 - Applications A doctors office staff studied the...Ch. 2.2 - CBSSports.com developed the Total Player Ratings...Ch. 2.2 - Based on the tons handled in a year, the ports...Ch. 2.2 - The London School of Economics and the Harvard...Ch. 2.2 - Fortune provides a list of Americas largest...Ch. 2.2 - entrepreneur magazine ranks franchises using...Ch. 2.2 - The DATAfile EngineeringSalary contains the median...Ch. 2.2 - Each year America.EDU ranks the best paying...Ch. 2.2 - The 2011 Cincinnati Flying Pig Half-Marathon (13.1...Ch. 2.3 - The following data are for 30 observations...Ch. 2.3 - The following observations are for two...Ch. 2.3 - The Daytona 500 is a 500-mile automobile race held...Ch. 2.3 - The following crosstabulation shows the average...Ch. 2.3 - Recently, management at Oak Tree Golf Course...Ch. 2.3 - The following crosstabulation shows the number of...Ch. 2.3 - Each year Forbes ranks the worlds most valuable...Ch. 2.3 - Refer to Table 2.12. a. Prepare a crosstabulation...Ch. 2.3 - The U.S. Department of Energys Fuel Economy Guide...Ch. 2.4 - The following 20 observations are for two...Ch. 2.4 - Consider the following data on two categorical...Ch. 2.4 - The following crosstabulation summarizes the data...Ch. 2.4 - A study on driving speed (miles per hour) and fuel...Ch. 2.4 - The Current Results website lists the average...Ch. 2.4 - People often wait until middle age to worry about...Ch. 2.4 - Smartphones are advanced mobile phones with...Ch. 2.4 - The Northwest regional manager of an outdoor...Ch. 2 - Approximately 1.5 million high school students...Ch. 2 - The DATAfile MedianHousehold contains the median...Ch. 2 - Data showing the population by state in millions...Ch. 2 - A startup companys ability to gain funding is a...Ch. 2 - Consumer complaints are frequently reported to the...Ch. 2 - The term Beta refers to a measure of a stocks...Ch. 2 - The U.S. Census Bureau serves as the leading...Ch. 2 - western University has only one womens softball...Ch. 2 - Fortune magazine publishes an annual survey of the...Ch. 2 - Table 2.18 shows a portion of the data for a...Ch. 2 - Refer to the data set in Table 2.18. a. Construct...Ch. 2 - Refer to the data set in Table 2.18. a. Construct...Ch. 2 - Refer to the data set in Table 2.18. a. Prepare a...Ch. 2 - Google has changed its strategy with regard to how...Ch. 2 - A zoo has categorized its visitors into three...Ch. 2 - Pelican Stores Pelican Stores, a division of...Ch. 2 - Motion Picture Industry The motion picture...Ch. 2 - Queen City Cincinnati, Ohio, also known as the...
Knowledge Booster


Learn more about
Need a deep-dive on the concept behind this application? Look no further. Learn more about this topic, statistics and related others by exploring similar questions and additional content below.Similar questions
- For each of the 32 National Football League teams, the numbers of points scored and allowed during the 2018 season are shown below. Team Wins Points Scored Points Allowed Team Wins PointsScored Points Allowed New York Jets 4 333 441 Chicago Bears 12 421 283 Cleveland Browns 7 359 392 Philadelphia Eagles 9 367 348 Denver Broncos 6 329 349 Tennessee Titans 9 310 303 Jacksonville Jaguars 5 245 316 Kansas City Chiefs 12 565 421 Minnesota Vikings 8 360 341 Baltimore Ravens 10 389 287 Oakland Raiders 4 290 467 Houston Texans 11 402 316 Cincinnati Bengals 6 368 455 Buffalo Bills 6 269 374 Washington Redskins 7 281 359 New Orleans Saints 13 504 353 Los Angeles Rams 13 527 384 Detroit Lions 6 324 360 Tampa Bay Buccaneers 5 396 464 Seattle Seahawks 10 428 347 Miami Dolphins 7 319 433 Indianapolis Colts 10 433 344 Pittsburgh Steelers 9 428 360 San Francisco 49ers 4 342 435 Green Bay Packers 6 376 400 Dallas Cowboys 10 339 324 New…arrow_forwardCalculate the difference between List Price and Sale Price for each condominium by creating a new column and use the Data Analysis Toolpak Descriptive Statistics for that new column for Gulf View. Gulf View Condominiums List Price Sale Price Days to Sell 478.0 474.0 133 394.0 329.0 85 537.0 532.0 82 542.5 543.5 91 353.9 314.9 132 553.0 506.0 74 143.9 168.0 197 201.0 224.0 59 962.0 919.0 91 317.0 324.0 117 328.0 291.0 95 883.0 823.0 277 965.0 1012.0 103 470.0 421.0 61 298.0 290.0 43 362.0 361.0 47 319.0 301.0 93 524.0 469.0 159 434.0 370.0 158 683.0 680.0 153 409.0 405.0 18 681.0 656.0 6 321.0 314.0 140 412.0 393.0 89 366.0 344.0 105 474.0 493.0 43 906.0 871.0 125 444.0 468.0 170 415.0 426.0 212 259.0 225.0 99 647.0 633.0 85 611.0 594.0 90 352.0 321.0 98 596.0 579.0 34 319.0 288.0 139 190.0 219.0 53 379.0 394.0 148 450.0 429.0 49 488.0 455.0 85 443.0 423.5 156arrow_forwardA U.S. magazine, Consumer Reports, carried out a survey of the calorie and sodium content of a number of different brands of hotdog. There were two types of hotdog: beef, ’meat‘ (mainly pork and beef but can contain up to 15% poultry) and poultry. The results below are the calorie content of the different brands of beef and poultry hotdogs. Beef hotdogs: 186,181,176,149,184,190,158,139,175,148,152,111,141,153,190,157,131,149,135,132 Poultry hotdogs: 129,132,102,106,94,102,87,99,170,113,135,142,86,143,152,146,144 Using six steps of hypothesis testing, determine if there is a strong evidence that the calorie content of poultry hotdogs is lower than the calorie content of beef hotdogs.arrow_forward
- The following data represent the responses to two questions asked in a survey of 40 college students majoring in business: What is your gender? 1M = male; F = female2 and What is your major? (A = Accounting; S = Statistics; M = Marketing): Q1. Tally the data into a contingency table where the two rows represent the gender categories and the three columns represent the academic major categories. Q2. Construct contingency tables based on percentages of all 40 student responses, based on row percentages and based on column percentages.arrow_forwardThe city council is considering a law that would ban smoking in all public parks. A sample has been selected from the community and tested for support of the ordinance. Age Support for Ban Less than 40 40+ Supports Ban 145 (58.5%) 78 (31.6%) 223 (45.1%) Against Ban 103 (41.5%) 169 (68.4%) 272 (54.9%) 248 (100%) 247 (100%) 495 (100%) a. How many degrees of freedom are there in this table? b. How many cells are in this table? c. Based on the column percents, what is the strength and direction of the relationship between age and support for anti-smoking laws? How did you determine these results?arrow_forwardA baker has 28 plain bagels and 20 blueberry bagels. If 25% of the plain bagels are gluten free and 10% of the blueberry bagels are gluten-free, then what is the percentage of gluten-free bagels?arrow_forward
- Auditors for the Military Airlift Command (MAC) are checking the arrival times of the three charter airlines they used in the Pacific last year. Branflake Airways flew 135 flights and was late 78 times. Flying Armadillo Airlines flew 94 flights and was late 35 times. Air Idaho flew 115 flights, with 51 late arrivals.Construct a cross-tabulation table (that shows both column-percentages and observed frequencies) in Microsoft Word (or by hand) to represent these data.arrow_forwardThe following table compares the completion percentage and interception percentage of 5 NFL quarterbacks. Completion Percentage Interception Percentage56 556 461 3.564 3.564 1.5arrow_forwardA fire-insurance company wants to relate the amount of fire damage in major residential fires to the distance between the residence and the nearest fire A sample of 6 recent fires in some suburb of a major city is selected. The amount of damage and the distance between the fire and the nearest fire station are recorded for each fire in the table below: Distance from fire station (miles) 2.9 1.3 4.4 1.8 2.6 5.1 Fire damage ($ thousands) 26.1 16.8 30.3 22.8 25.1 35arrow_forward
- If a data set contains three groups that each have ten people in them, how many rows will the “data view” have? 30 3 100 10arrow_forwardWhat percentage of customers in the sample prefer Action movies ? Complete the frequency table based on the Pivot table information MovieGenre Female Male Total Action Comedy Drama SciFi Total INSERT PIVOT TABLE HERE Sum of DollarAmt ($) Column Labels Row Labels Female Male Grand Total Action 2361 1715 4076 Comedy 1614 95 1709 Drama 4399 6403 10802 SciFi 5133 2636 7769 Grand Total 13507 10849 24356arrow_forwardSuppose a magazine ranks the best paying college degrees in a country. The following data show the median starting salary, the mid-career salary, and the percentage increase from starting salary to mid-career salary for the 20 college degrees with the highest mid-career salary. Degree Starting Salary Mid-Career Salary % Increase College Degree A 59,400 108,000 82 College Degree B 56,400 101,000 79 College Degree C 54,800 101,000 84 College Degree D 64,800 108,000 67 College Degree E 53,500 93,400 75 College Degree F 61,200 87,700 43 College Degree G 56,200 97,700 74 College Degree H 50,400 87,000 73 College Degree I 48,800 97,800 100 College Degree J 60,800 109,000 79 College Degree K 47,500 91,500 93 College Degree L 41,500 88,300 113 College Degree M 49,300 87,100 77 College Degree N 50,900 90,300 77 College Degree O 46,400 88,300 90 College Degree P 63,900 109,000 71 College Degree Q 93,000 159,000 71 College Degree R 50,700 99,600 96 College…arrow_forward
arrow_back_ios
SEE MORE QUESTIONS
arrow_forward_ios
Recommended textbooks for you
 Glencoe Algebra 1, Student Edition, 9780079039897...AlgebraISBN:9780079039897Author:CarterPublisher:McGraw Hill
 Holt Mcdougal Larson Pre-algebra: Student Edition...AlgebraISBN:9780547587776Author:HOLT MCDOUGALPublisher:HOLT MCDOUGAL
 Big Ideas Math A Bridge To Success Algebra 1: Stu...AlgebraISBN:9781680331141Author:HOUGHTON MIFFLIN HARCOURTPublisher:Houghton Mifflin Harcourt
Glencoe Algebra 1, Student Edition, 9780079039897...
Algebra
ISBN:9780079039897
Author:Carter
Publisher:McGraw Hill
Holt Mcdougal Larson Pre-algebra: Student Edition...
Algebra
ISBN:9780547587776
Author:HOLT MCDOUGAL
Publisher:HOLT MCDOUGAL
Big Ideas Math A Bridge To Success Algebra 1: Stu...
Algebra
ISBN:9781680331141
Author:HOUGHTON MIFFLIN HARCOURT
Publisher:Houghton Mifflin Harcourt
How to make Frequency Distribution Table / Tally Marks and Frequency Distribution Table; Author: Reenu Math;https://www.youtube.com/watch?v=i_A6RiE8tLE;License: Standard YouTube License, CC-BY
Frequency distribution table in statistics; Author: Math and Science;https://www.youtube.com/watch?v=T7KYO76DoOE;License: Standard YouTube License, CC-BY
Frequency Distribution Table for Grouped/Continuous data | Math Dot Com; Author: Maths dotcom;https://www.youtube.com/watch?v=ErnccbXQOPY;License: Standard Youtube License