
Modern Business Statistics with Microsoft Office Excel (with XLSTAT Education Edition Printed Access Card) (MindTap Course List)
6th Edition
ISBN: 9781337115186
Author: David R. Anderson, Dennis J. Sweeney, Thomas A. Williams, Jeffrey D. Camm, James J. Cochran
Publisher: Cengage Learning
expand_more
expand_more
format_list_bulleted
Videos
Textbook Question
Chapter 2.3, Problem 35E
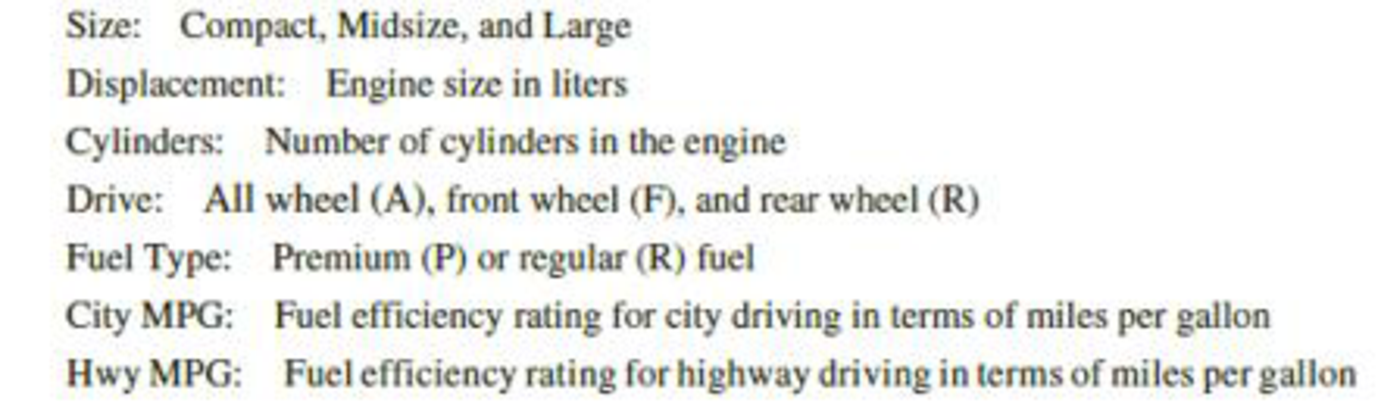
The U.S. Department of Energy's Fuel Economy Guide provides fuel efficiency data for cars and trucks (Fuel Economy website, September 8. 2012). A portion of the data for 149 compact, midsize, and large cars is shown in Table 2.13. The data set contains the following variables:
The complete data set is contained in the DATA file named FuelData2012.
- a. Prepare a crosstabulation of the data on Size (rows) and Hwy MPG (columns). Use classes of 15–19, 20-24, 25–29, 30–34, 35–39, and 40–44 for Hwy MPG.
- b. Comment on the relationship between Size and Hwy MPG.
- c. Prepare a crosstabulation of the data on Drive (rows) and City MPG (columns) Use classes of 10–14, 15–19, 20–24, 25–29, 30–34, and 35–39, and 40–4 for City MPG.
- d. Comment on the relationship between Drive and City MPG.
- e. Prepare a crosstabulation of the data on Fuel Type (rows) and City MPG (columns). Use classes of 10–14, 15–19, 20–24, 25–29, 30–34, 35–39. And 40–44 for City MPG.
- f. Comment on the relationship between Fuel Type and City MPG.
Expert Solution & Answer

Trending nowThis is a popular solution!

Students have asked these similar questions
The U.S. Department of Energy’s Fuel Economy Guide provides fuel efficiency datafor cars and trucks (Fuel Economy website, September, 2012). A portion of the data for149 compact, midsize, and large cars is shown in Table 2.13. The data set contains thefollowing variables:Size: Compact, Midsize, and LargeDisplacement: Engine size in litersCylinders: Number of cylinders in the engineDrive: All wheel (A), front wheel (F), and rear wheel (R)Fuel Type: Premium (P) or regular (R) fuelCity MPG: Fuel efficiency rating for city driving in terms of miles per gallonHwy MPG: Fuel efficiency rating for highway driving in terms of miles per gallonThe complete data set is contained in the file named FuelData2012.a. Prepare a crosstabulation of the data on Size (rows) and Hwy MPG (columns). Useclasses of 15–19, 20–24, 25–29, 30–34, 35–39, and 40–44 for Hwy MPG.b. Comment on the relationship beween Size and Hwy MPG.
The U.S. Department of Energy’s Fuel Economy Guide provides fuel efficiency datafor cars and trucks (Fuel Economy website, September, 2012). A portion of the data for149 compact, midsize, and large cars is shown in Table 2.13. The data set contains thefollowing variables:Size: Compact, Midsize, and LargeDisplacement: Engine size in litersCylinders: Number of cylinders in the engineDrive: All wheel (A), front wheel (F), and rear wheel (R)Fuel Type: Premium (P) or regular (R) fuelCity MPG: Fuel efficiency rating for city driving in terms of miles per gallonHwy MPG: Fuel efficiency rating for highway driving in terms of miles per gallonThe complete data set is contained in the file named FuelData2012.a. Prepare a crosstabulation of the data on Size (rows) and Hwy MPG (columns). Useclasses of 15–19, 20–24, 25–29, 30–34, 35–39, and 40–44 for Hwy MPG.b. Comment on the relationship beween Size and Hwy MPG.c. Prepare a crosstabulation of the data on Drive (rows) and City MPG (columns).…
City
Hotel Room Rate ($)
Entertainment ($)
Boston
144
161
Denver
96
103
Nashville
88
103
New Orleans
112
143
Phoenix
89
100
San Diego
100
119
San Francisco
137
166
San Jose
93
138
Tampa
86
99
Concur Technologies, Inc., is a large expense-management company located in Redmond, Washington. The Wall Street Journal asked Concur to examine the data from 8.3 million expense reports to provide insights regarding business travel expenses. Their analysis of the data showed that New York was the most expensive city, with an average daily hotel room rate of $198 and an average amount spent on entertainment, including group meals and tickets for shows, sports, and other events, of $172. In comparison, the U.S. averages for these two categories were $89 for the room rate and $99 for entertainment. The table in the Excel Online file below shows the average daily hotel room rate and the amount spent on entertainment for a random sample of 9 of the 25 most visited U.S. cities (The…
Chapter 2 Solutions
Modern Business Statistics with Microsoft Office Excel (with XLSTAT Education Edition Printed Access Card) (MindTap Course List)
Ch. 2.1 - Methods
1. The response to a question has three...Ch. 2.1 - 2. A partial relative frequency distribution is...Ch. 2.1 - A questionnaire provides 58 Yes, 42 No, and 20...Ch. 2.1 -
For the 2010–2011 viewing season, the top five...Ch. 2.1 -
In alphabetical order, the six most common last...Ch. 2.1 - Top Rated Television Show Networks. Nielsen Media...Ch. 2.1 - Airline Customer Satisfaction Survey. Many...Ch. 2.1 - Prob. 8ECh. 2.1 - Prob. 9ECh. 2.1 -
VirtualTourist provides ratings for hotels...
Ch. 2.2 - 11. Consider the following data.
Develop a...Ch. 2.2 - 12. Consider the following frequency...Ch. 2.2 - Construct a histogram for the data in exercise...Ch. 2.2 - Prob. 14ECh. 2.2 - Construct a stem-and-leaf display for the...Ch. 2.2 - Construct a stem-and-leaf display for the...Ch. 2.2 - Applications
17. A doctor’s office staff studied...Ch. 2.2 - NBA Total Player Ratings. CBSSports.com developed...Ch. 2.2 - Prob. 19ECh. 2.2 - CEO Time in Meetings. The London School of...Ch. 2.2 - Quantcast.com provides the number of people from...Ch. 2.2 - Top U.S. Franchises. Entrepreneur magazine ranks...Ch. 2.2 - Prob. 24ECh. 2.2 - Best Paying College Degrees. Each year America.EDU...Ch. 2.2 - Prob. 26ECh. 2.3 - The following data are for 30 observations...Ch. 2.3 - The following observations are for two...Ch. 2.3 - Daytona 500 Automobile Makes Average Speeds. The...Ch. 2.3 - Daytona 500 Average Speeds of Winners. The...Ch. 2.3 - 31. Recently, management at Oak Tree Golf Course...Ch. 2.3 - Household Income Levels. The following...Ch. 2.3 - 33. Each year Forbes ranks the world’s most...Ch. 2.3 - Prob. 34ECh. 2.3 -
The U.S. Department of Energy's Fuel Economy...Ch. 2.4 - The following 20 observations are for two...Ch. 2.4 - Prob. 37ECh. 2.4 - The following crosstabulation summarizes the data...Ch. 2.4 - Driving Speed and Fuel Efficiency. A study on...Ch. 2.4 - The DATAfile Snow contains average annual snowfall...Ch. 2.4 - Hypertension and Heart Disease. People often wait...Ch. 2.4 -
Smartphones are mobile phones with Internet,...Ch. 2.4 - Store Managers Time Study. The Northwest regional...Ch. 2 - SAT Scores. The SAT is a standardized test used by...Ch. 2 - Median Household Incomes. The file MedianHousehold...Ch. 2 - State Populations. Data showing the population by...Ch. 2 - Startup Company Funds. According to the Wall...Ch. 2 - Complaints Reported to BBB. Consumer complaints...Ch. 2 - Stock Price Volatility. The term “beta” refers to...Ch. 2 - Education Level and Household Income. The U.S....Ch. 2 - Prob. 51SECh. 2 - Best Places to Work. Fortune magazine publishes an...Ch. 2 - Prob. 53SECh. 2 - Prob. 54SECh. 2 - Prob. 55SECh. 2 - Prob. 56SECh. 2 -
Google has changed its strategy with regard to...Ch. 2 -
A zoo has categorized its visitors into three...Ch. 2 - Pelican Stores, a division of National Clothing,...Ch. 2 -
Motion Picture Industry
The motion picture...Ch. 2 - Cincinnati, Ohio, also known as the Queen City,...Ch. 2 - Jon Weideman, first shift foreman for Cut-Rate...
Knowledge Booster


Learn more about
Need a deep-dive on the concept behind this application? Look no further. Learn more about this topic, statistics and related others by exploring similar questions and additional content below.Similar questions
- The data contained in the file FoodIndustry show the company/chain name, the average sales per store ($1,000s), and the food segment industry for 47 restaurant chains.† Company Segment 2012 U.S.AverageSales perStore($1,000s) Arby's Sandwich 993 Baskin-Robbins Snacks 207 Bojangles' Chicken 1,718 Boston Market Chicken 1,184 Burger King Burger 1,195 Carl's Jr. Burger 1,470 Checkers/Rally's Burger 903 Chick-fil-A Chicken 3,158 Chipotle MexicanGrill Mexican 2,113 Church's Chicken Chicken 707 CiCi's Pizza Pizza/Pasta 915 Culver's Burger 1,838 Dairy Queen Burger 545 Del Taco Mexican 1,100 Domino's Pizza Pizza/Pasta 710 Dunkin' Donuts Snacks 857 El Pollo Loco Chicken 1,475 Five GuysBurgers & Fries Burger 1,049 Hardee's Burger 1,145 In-N-Out Burger Burger 1,935 Jack in the Box Burger 1,379 Jamba Juice Snacks 715 Jason's Deli Sandwich 2,556 Jimmy John's Sandwich 879 Company Segment 2012 U.S.AverageSales perStore($1,000s) KFC…arrow_forwardThe data contained in the file FoodIndustry show the company/chain name, the average sales per store ($1,000s), and the food segment industry for 47 restaurant chains.† Company Segment 2012 U.S.AverageSales perStore($1,000s) Arby's Sandwich 993 Baskin-Robbins Snacks 207 Bojangles' Chicken 1,718 Boston Market Chicken 1,184 Burger King Burger 1,195 Carl's Jr. Burger 1,470 Checkers/Rally's Burger 903 Chick-fil-A Chicken 3,158 Chipotle MexicanGrill Mexican 2,113 Church's Chicken Chicken 707 CiCi's Pizza Pizza/Pasta 915 Culver's Burger 1,838 Dairy Queen Burger 545 Del Taco Mexican 1,100 Domino's Pizza Pizza/Pasta 710 Dunkin' Donuts Snacks 857 El Pollo Loco Chicken 1,475 Five GuysBurgers & Fries Burger 1,049 Hardee's Burger 1,145 In-N-Out Burger Burger 1,935 Jack in the Box Burger 1,379 Jamba Juice Snacks 715 Jason's Deli Sandwich 2,556 Jimmy John's Sandwich 879 Company Segment 2012 U.S.AverageSales perStore($1,000s) KFC…arrow_forwardAccording to the All Pakistan Software Developer Association (APSDA), developers generally spend more than 40 hours each week working on software and web development. The Table 4.1 shows the number of hours worked per week for a sample of 15 Software developers and a sample of 10 Web developers. Table 4.1 Software Developers 56 54 54 49 61 48 58 60 59 53 50 58 55 57 52 Web Developers 47 50 46 47 48 49 46 55 44 42 - Comment on the differences between the box plots for Software & Web developersdevelopers? Use excel to solve this question and also show the formulasarrow_forward
- The higher education department of Institute recorded data on the number of studentsenrolled in the different study majors for the years 2018 and 2019. Study Major 2018 2019 Statistics 1700 2250 Business Law 700 900 Accounting 1300 1450 Economics 750 1000 Finance 1450 1758 Marketing Management 1069 1189 Auditing 360 351 a) Use an appropriate graphical technique or chart to compare the number of enrolment in 2018and 2019 of the different study major. Display the chart. b) Use an appropriate graphical technique or chart to display the percentage value of the numberof enrolment of the different study major in 2018 and 2019. Display the chart.arrow_forwardif a data set follows a skewed distrubition, which measure of center can be used as a center for the data set ____arrow_forwardThe manager of an auto dealership would like to develop a model the fuel consumption of various car models based on engine size. The data is presented below. Manufacturer Engine Size (litre) Fuel Consumption (litres/100km,city driving) Hyundai Accent 1.5 8.9 Toyota Echo 1.5 7.1 Hyundai Accent 1.6 8.9 Kia rio 1.6 9.3 Mazda Protege 1.6 9.3 Honda Civic 1.7 8.1 Kia Spectra 1.8 10.9 Nissan Sentra 1.8 8.3 Pontiac Vibe 1.8 8.3 Toyota Corolla 1.8 8.1 Dodge SX 2.0 2 9.3 Ford Focus 2 8.9 Hyundai Elantra 2 9.6 Mazda Protege/proteges 2 9.9 Mitsubishi Lancer 2 9.7 Suzuki Aerio 2 9.1 Volkswagen Golf 2 10.1 Volkswagen Jetta 2 10.1 Chevrolet Cavalier 2.2 10 Oldsmobile Alero 2.2 10.1 Pontiac Grand AM 2.2 10 Saturn Ion 2.2 9.9 Saturn L200 2.2 10.1 Chrysler Sebring 2.4 10.6 Honda Accord 2.4 9.6 Hyundai Sonata 2.4 10.9 Kia Magentis 2.4 10.9 Mitsubishi Galant 2.4 11.3 Toyota Camry 2.4 10.2 Nissan Altima 2.5 10.4 Nissan Sentra 2.5 10.4…arrow_forward
- A mail-order catalog business that sells personal computer supplies, software, and hardware maintains a centralized warehouse for the distribution of products ordered. Management is currently examining the process of distribution from the warehouse and has the business objective of determining the factors that affect warehouse distribution costs. Currently, a handling fee is added to the order, regardless of the amount of the order. Data that indicate the warehouse distribution costs and the number of orders received have been collected over the past 24 months and can be seen below: Months Distribution Cost ($thousands) Number of Orders 1 52.95 4015 2 71.66 3806 3 85.58 5309 4 63.69 4262 5 72.81 4296 6 68.44 4097 7 52.46 3213 8 70.77 4809 9 82.03 5237 10 74.39 4732 11 70.84 4413 12 54.08 2921 13 62.98 3977 14 72.30 4428 15 58.99 3964 16 79.38 4582…arrow_forwardIn the packaging department of a large aircraft parts distributor, a fairly reliable estimate ofpackaging and processing costs can be determined by knowing the weight of an order. Thus, theweight is a cost driver that accounts for a sizable fraction of the packaging and processing costsat this company. Data for the past 10 orders are given as follows:arrow_forwardAccording to the 2017 Corporate Travel Index compiled by Business Travel News, the average daily cost for business travel in the United States rose to $321 per day (Executive Travel website). The file Travel contains sample data for an analogous study on the estimated daily living costs for an executive traveling to various international cities. The estimates include a single room at a four-star hotel, beverages, breakfast, taxi fares, and incidental costs. City Daily LivingCost ($) City 1 242.87 City 2 260.93 City 3 194.19 City 4 260.76 City 5 355.36 City 6 346.32 City 7 165.37 City 8 250.08 City 9 326.76 City 10 283.56 City Daily LivingCost ($) City 11 213.00 City 12 284.08 City 13 139.16 City 14 436.72 City 15 240.87 City 16 310.41 City 17 223.73 City 18 181.25 City 19 238.10 City 20 250.61 (a)Compute the sample mean (in dollars). (Round your answer to the nearest cent.) $______ (b)Compute the sample standard deviation…arrow_forward
- Refer to the data file P08_63.xlsx. SoftBus Company sells PC equipment and customized software to small companies to help them manage their day-to-day business activities. Although SoftBus spends time with all customers to understand their needs, the customers are eventually on their own to use the equipment and software intelligently. To understand its customers better, SoftBus recently sent questionnaires to a large number of prospective customers. Key personnel—those who would be using the software—were asked to fill out the questionnaire. SoftBus received 82 usable responses, as shown in the file. You can assume that these employees represent a random sample of all of SoftBus's prospective customers. SoftBus believes it can afford to spend much less time with customers who own PCs and score at least 4 on PC Knowledge. Let's call these the "PC-savvy" customers. On the other hand, SoftBus believes it will have to spend a lot of time with customers who do not own a PC and score 2 or…arrow_forwardThe manager of an auto dealership would like to develop a model the fuel consumption of various car models based on engine size. The data is presented below Manufacturer, Model Engine Size (litre) Fuel Consumption (litres/100km, city driving) HYUNDAI ACCENT 1.5 8.9 TOYOTA ECHO 1.5 7.1 HYUNDAI ACCENT 1.6 8.9 KIA RIO 1.6 9.3 MAZDA PROTEGE 1.6 9.3 HONDA CIVIC 1.7 8.1 KIA SPECTRA 1.8 10.9 NISSAN SENTRA 1.8 8.3 PONTIAC VIBE 1.8 8.3 TOYOTA COROLLA 1.8 8.1 DODGE SX 2.0 2 9.3 FORD FOCUS 2 8.9 HYUNDAI ELANTRA 2 9.6 MAZDA PROTEGE/PROTEGE5 2 9.9 MITSUBISHI LANCER 2 9.7 SUZUKI AERIO 2 9.1 VOLKSWAGEN GOLF 2 10.1 VOLKSWAGEN JETTA 2 10.1 CHEVROLET CAVALIER 2.2 10 OLDSMOBILE ALERO 2.2 10.1 PONTIAC GRAND AM 2.2 10 SATURN ION 2.2 9.9 SATURN L200 2.2 10.1 CHRYSLER SEBRING 2.4 10.6 HONDA ACCORD 2.4…arrow_forwardThe manager of an auto dealership would like to develop a model the fuel consumption of various car models based on engine size. The data is presented below Manufacturer, Model Engine Size (litre) Fuel Consumption (litres/100km, city driving) HYUNDAI ACCENT 1.5 8.9 TOYOTA ECHO 1.5 7.1 HYUNDAI ACCENT 1.6 8.9 KIA RIO 1.6 9.3 MAZDA PROTEGE 1.6 9.3 HONDA CIVIC 1.7 8.1 KIA SPECTRA 1.8 10.9 NISSAN SENTRA 1.8 8.3 PONTIAC VIBE 1.8 8.3 TOYOTA COROLLA 1.8 8.1 DODGE SX 2.0 2 9.3 FORD FOCUS 2 8.9 HYUNDAI ELANTRA 2 9.6 MAZDA PROTEGE/PROTEGE5 2 9.9 MITSUBISHI LANCER 2 9.7 SUZUKI AERIO 2 9.1 VOLKSWAGEN GOLF 2 10.1 VOLKSWAGEN JETTA 2 10.1 CHEVROLET CAVALIER 2.2 10 OLDSMOBILE ALERO 2.2 10.1 PONTIAC GRAND AM 2.2 10 SATURN ION 2.2 9.9 SATURN L200 2.2 10.1 CHRYSLER SEBRING 2.4 10.6 HONDA ACCORD 2.4…arrow_forward
arrow_back_ios
arrow_forward_ios
Recommended textbooks for you
 Glencoe Algebra 1, Student Edition, 9780079039897...AlgebraISBN:9780079039897Author:CarterPublisher:McGraw Hill
 Linear Algebra: A Modern IntroductionAlgebraISBN:9781285463247Author:David PoolePublisher:Cengage Learning
 Big Ideas Math A Bridge To Success Algebra 1: Stu...AlgebraISBN:9781680331141Author:HOUGHTON MIFFLIN HARCOURTPublisher:Houghton Mifflin Harcourt
Glencoe Algebra 1, Student Edition, 9780079039897...
Algebra
ISBN:9780079039897
Author:Carter
Publisher:McGraw Hill
Linear Algebra: A Modern Introduction
Algebra
ISBN:9781285463247
Author:David Poole
Publisher:Cengage Learning
Big Ideas Math A Bridge To Success Algebra 1: Stu...
Algebra
ISBN:9781680331141
Author:HOUGHTON MIFFLIN HARCOURT
Publisher:Houghton Mifflin Harcourt
F- Test or F- statistic (F- Test of Equality of Variance); Author: Prof. Arvind Kumar Sing;https://www.youtube.com/watch?v=PdUt7InTyc8;License: Standard Youtube License
Statistics 101: F-ratio Test for Two Equal Variances; Author: Brandon Foltz;https://www.youtube.com/watch?v=UWQO4gX7-lE;License: Standard YouTube License, CC-BY
Hypothesis Testing and Confidence Intervals (FRM Part 1 – Book 2 – Chapter 5); Author: Analystprep;https://www.youtube.com/watch?v=vth3yZIUlGQ;License: Standard YouTube License, CC-BY
Understanding the Levene's Test for Equality of Variances in SPSS; Author: Dr. Todd Grande;https://www.youtube.com/watch?v=udJr8V2P8Xo;License: Standard Youtube License