
Videos
(a)
To sketch: The graph of the function
(a)
Explanation of Solution
The given function is
Where,
- E is the energy radiated per unit of surface area measured in Watts.
- T is the absolute temperature in Kelvin.
Use graphing calculator to draw the graph of the Function E with values of T between 100 K and 300 K as shown below in Figure 1.
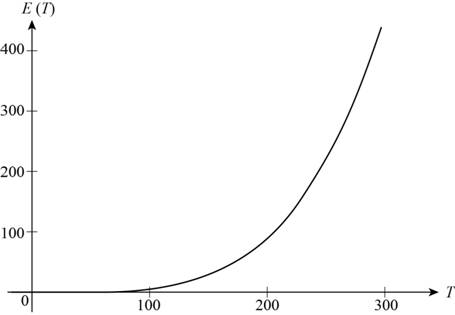
Figure (1)
From Figure (1), it is noticed that the value of
(b)
To explain: The change in Energy E as the temperature increases.
(b)
Explanation of Solution
From Figure (1), it is clearly visible that the graph rises for all the values of T between 100 K and 300 K. It means that the function E is increasing on the interval
Chapter 2 Solutions
Precalculus: Mathematics for Calculus - 6th Edition


 Calculus: Early TranscendentalsCalculusISBN:9781285741550Author:James StewartPublisher:Cengage Learning
 Thomas' Calculus (14th Edition)CalculusISBN:9780134438986Author:Joel R. Hass, Christopher E. Heil, Maurice D. WeirPublisher:PEARSON
 Calculus: Early Transcendentals (3rd Edition)CalculusISBN:9780134763644Author:William L. Briggs, Lyle Cochran, Bernard Gillett, Eric SchulzPublisher:PEARSON
 Calculus: Early TranscendentalsCalculusISBN:9781319050740Author:Jon Rogawski, Colin Adams, Robert FranzosaPublisher:W. H. Freeman
 Calculus: Early Transcendental FunctionsCalculusISBN:9781337552516Author:Ron Larson, Bruce H. EdwardsPublisher:Cengage Learning