Below are some data from the land of milk and honey a) Compute nominal GDP, real GDP, and the GDP deflator for each year, using 2017 as the base year. Hints: show steps. b) Compute the percentage change in nominal GDP, real GDP, and the GDP deflator in 2018 and 2019 from the preceding year. For each year, identify the variable that does not change. Explain in words why your answer makes sense. Hints: show steps. c) Did economic well-being rise more in 2018 or 2019? Explain.
Below are some data from the land of milk and honey a) Compute nominal GDP, real GDP, and the GDP deflator for each year, using 2017 as the base year. Hints: show steps. b) Compute the percentage change in nominal GDP, real GDP, and the GDP deflator in 2018 and 2019 from the preceding year. For each year, identify the variable that does not change. Explain in words why your answer makes sense. Hints: show steps. c) Did economic well-being rise more in 2018 or 2019? Explain.

Principles of Economics 2e
2nd Edition
ISBN:9781947172364
Author:Steven A. Greenlaw; David Shapiro
Publisher:Steven A. Greenlaw; David Shapiro
ChapterA: The Use Of Mathematics In Principles Of Economics
Section: Chapter Questions
Problem 3RQ: Exercise A3 What dome slices of a pie chart represent?

Related questions
Question
Below are some data from the land of milk and honey
-
a) Compute nominal
GDP , real GDP, and the GDP deflator for each year, using 2017 as the base year. Hints: show steps. -
b) Compute the percentage change in nominal GDP, real GDP, and the GDP deflator in 2018 and 2019 from the preceding year. For each year, identify the variable that does not change. Explain in words why your answer makes sense. Hints: show steps.
-
c) Did economic well-being rise more in 2018 or 2019? Explain.
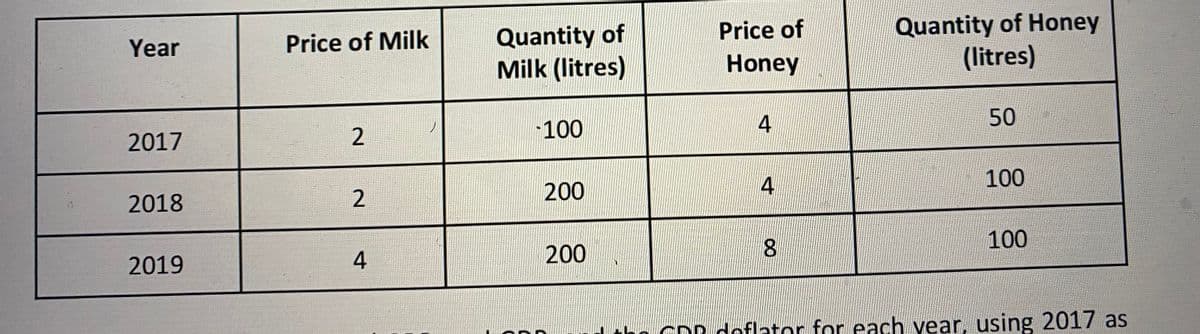
Transcribed Image Text:Quantity of Honey
(litres)
Price of
Quantity of
Milk (litres)
Year
Price of Milk
Honey
50
2.
100
2017
4.
100
2
200
2018
8.
100
2019
4
200
GDR deflator for each vear, using 2017 as
CO
Expert Solution
This question has been solved!
Explore an expertly crafted, step-by-step solution for a thorough understanding of key concepts.

This is a popular solution!

Trending now
This is a popular solution!

Step by step
Solved in 4 steps

Knowledge Booster


Learn more about
Need a deep-dive on the concept behind this application? Look no further. Learn more about this topic, economics and related others by exploring similar questions and additional content below.Recommended textbooks for you
Principles of Economics 2e
Economics
ISBN:
9781947172364
Author:
Steven A. Greenlaw; David Shapiro
Publisher:
OpenStax
Principles of Economics 2e
Economics
ISBN:
9781947172364
Author:
Steven A. Greenlaw; David Shapiro
Publisher:
OpenStax