Concept explainers
Videos
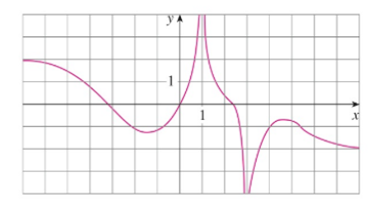
For the function f whose graph is given, state the following.
(a)
(b)
(c)
(d)
(e) The equations of the asymptotes

Trending nowThis is a popular solution!

Chapter 2 Solutions
Student Solutions Manual for Stewart's Single Variable Calculus: Early Transcendentals, 8th (James Stewart Calculus)
Additional Math Textbook Solutions
Precalculus: A Unit Circle Approach
Calculus & Its Applications (14th Edition)
Precalculus: A Unit Circle Approach (3rd Edition)
University Calculus: Early Transcendentals (4th Edition)
Calculus Early Transcendentals, Binder Ready Version
Single Variable Calculus: Early Transcendentals (2nd Edition) - Standalone book


- The graph of fx=1/x is a .arrow_forwardThe line x = c is a asymptote of the graph of a function f if f(x) approaches infinity or negative from either the left or right. infinity as x approachesarrow_forwardA function and its graph are given. f(x) = + 4x2 - 20x – 20 y 250 200 150 100 50 - 10 -5 5 –50 (a) From the graph, estimate where f"(x) > 0. (Enter your answer using interval notation.) Estimate where f"(x) o. (Enter your answer using interval notation.) Find where f"x) < 0. (Enter your answer using interval notation.) Find where f"(x) = 0. (Enter your answers as a comma-separated list.) Find where r(x) has its relative maxima and relative minima. (Enter your answers as comma-separated lists. If an answer does not exist, enter DNE.) relative maxima relative minimaarrow_forward
- (a) Draw the graph of f(x)arrow_forwardThe graph of y=f(x) to the right gives the speed limit y along a rural highway x miles from its starting point. (a) What are the maximum and minimum speed limits along this stretch of highway? Estimate the miles of highway with a speed limit of 50 miles per hour. (b) Evaluate f(16), f(32), and f(36). And at what x-values is the graph discontinuous? Interpret each discontinuity.a) Along this stretch of highway, the maximum speed limit is ___ miles per hour and the minimum speed limit is ____ miles per hour.There are ___ miles of highway with a speed limit of 50 miles per hour.b) Evaluate.f(16) = _____f(32) = _____f(36) = _____At what x-values is the graph discontinuous? _____ (Use a comma to seperate answers.)Interpret the discontinuities. Choose the correct interpretaion below.A) The speed limit changes at each discontinuity.B) The road changes names at each discontinuity.C) There is no speed limit data for the discontinuities.D) The altitude changes at each discontinuity.arrow_forwardGraph both functions as follows: graph the first function f(x), labeling the appropriate intercept and asymptote on the graph to the left. Then use transformations to graph the second function g(x) on the graph to the right. Be sure to label where the intercept and asymptote have moved to in the graph of g(x). Plot at least 3 points on each function to justify your graphs. 8) Graph f(x) = 3X and use this graph to obtain the graph of g(x) = 3X+1. US V Oarrow_forward
 Algebra for College StudentsAlgebraISBN:9781285195780Author:Jerome E. Kaufmann, Karen L. SchwittersPublisher:Cengage Learning
 Algebra & Trigonometry with Analytic GeometryAlgebraISBN:9781133382119Author:SwokowskiPublisher:Cengage
 College AlgebraAlgebraISBN:9781305115545Author:James Stewart, Lothar Redlin, Saleem WatsonPublisher:Cengage Learning

 Big Ideas Math A Bridge To Success Algebra 1: Stu...AlgebraISBN:9781680331141Author:HOUGHTON MIFFLIN HARCOURTPublisher:Houghton Mifflin Harcourt