
Videos
Tree Rings Reveal Droughts El Malpais National Monument, in west central New Mexico, has pockets of vegetation that have been surrounded by lava fields for about 3,000 years, so they have escaped wildfires, grazing animals, agricultural activity, and logging. Henri Grissino-Mayer generated a 2,129-year annual precipitation record using tree ring data from living and dead trees in this park (FIGURE 27.22).
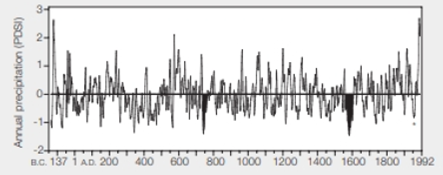
FIGURE 27.22 Annual precipitation record for 2,129 years, inferred from compiled tree ring data in El Malpais National Monument, New Mexico. Data were averaged over 10-year intervals; the graph correlates with other indicators of rainfall collected in all parts of North America. PDSI, Palmer Drought Severity Index: 0, normal rainfall; increasing numbers mean increasing excess of rainfall; decreasing numbers mean increasing severity of drought.
* A severe drougt contributed to a series of catastrophic dust storms that turned the midwestern United States into a "dust bowl" between 1933 and 1939.
Around a.d.770, the Mayan civilization began to suffer a massive population loss, particularly in the southern lowlands of Mesoamerica. The El Malpais tree ring data show a drought during that time. Was it more or less severe than the Dust Bowl drought in 1933–1939?
To determine: Whether the drought at A.D. 770 was more or less severe than the Dust Bowl drought in 1933-1939.
Concept introduction: Tree rings are the number of concentric rings in the cross section of the tree trunks that represent a single year growth. Tree ring dating is done to find the exact year of their formation. Tree ring dating helps to analyze the atmospheric condition during the different periods in history. The researchers have created the record of drought dating back hundreds to thousands of years by using tree rings.
Explanation of Solution
The Mayan civilization suffers a massive population loss in the 770 AD. Between 1933 and 1939, a severe drought contributed to the series of the catastrophic dust storms that turned the Midwestern Unites States into a dust bowl. From the data, there is a point that extends to about -1.5 PDSI at 770 A.D. It indicates a severe drought. The dust bowl drought which is indicated by a * on the graph has a PDSI of about -1. Comparing to the drought at 770 A.D. it was more severe than the dust bowl.
The drought in the 770 A.D. was more severe than the drought during the dust bowl.
Want to see more full solutions like this?
Chapter 27 Solutions
Biology: The Unity and Diversity of Life (MindTap Course List)
Additional Science Textbook Solutions
Genetics: From Genes to Genomes, 5th edition
Human Anatomy & Physiology (2nd Edition)
Seeley's Anatomy & Physiology
Genetics: Analysis and Principles
Microbiology Fundamentals: A Clinical Approach
Campbell Biology: Concepts & Connections (9th Edition)


- Tree Rings and Droughts El Malpais National Monument, in west central New Mexico, has pockets of vegetation that have been surrounded by lava fields for about 3,000 years, so they have escaped wildfires, grazing animals, agricultural activity, and logging. Henri Grissino-Mayer generated a 2,129-year annual precipitation record using tree ring data from living and dead trees in this park (FIGURE 27.23). FIGURE 27.23 A 2.129-year annual precipitation record inferred from com pled tree ring data in El Malpais National Monument Now Mexico. Data ware averaged over 10-yeer intervals; graph correlates with other indicators of rainfall collected in all parts of North America. PDSI, Palmer Drought Severity Index: O, normal rainfall increasing numbers mean increasing excess of rainfall decreasing numbers mean increasing severity of drought A severe drought contributed to a series of catastrophic dust stem's that turned the rid western United States into a oust bow between 1933 and 1939. 1. Around 770 A. D., the Mayan civilization began to suffer a massive population loss, particularly in the southern lowlands of Mesoamerica. The El Malpais tree ring data show a drought during that time. Was it more or less severe than the dust bowl drought?arrow_forwardTree Rings Reveal Droughts El Malpais National Monument, in west central New Mexico, has pockets of vegetation that have been surrounded by lava fields for about 3,000 years, so they have escaped wildfires, grazing animals, agricultural activity, and logging. Henri Grissino-Mayer generated a 2,129-year annual precipitation record using tree ring data from living and dead trees in this park (FIGURE 27.22). FIGURE 27.22 Annual precipitation record for 2,129 years, inferred from compiled tree ring data in El Malpais National Monument, New Mexico. Data were averaged over 10-year intervals; the graph correlates with other indicators of rainfall collected in all parts of North America. PDSI, Palmer Drought Severity Index: 0, normal rainfall; increasing numbers mean increasing excess of rainfall; decreasing numbers mean increasing severity of drought. A severe drougt contributed to a series of catastrophic dust storms that turned the midwestern United States into a "dust bowl" between 1933 and 1939. One of the worst population catastrophes ever recorded occurred in Mesoamerica between 1519 and a.d. 1600, when around 22 million people native to the region died. Which period between 137 b.c. and 1992 had the most severe drought? How long did that drought last?arrow_forward13. Tree densities that are very low (scattered trees are too far apart for branches or leaves to touch neighboring trees) characterize which of the following forest categories? A. temperate deciduous forests B. boreal forests C. closed canopy forests D. savannas E. tropical rain forestsarrow_forward
- All of the following are reasons why tropical rain forests less likely to grow back as secondary growth forests after widespread deforestation (when compared to temperate forests) EXCEPT: Question 25 options: - All of the above are significant reasons why tropical rain forests may not grow back after widespread deforestation. The soil of tropical rain forests contains much less organic matter and nutrients compared to the soil of temperate forests. - The trees in tropical rain forests are largely responsible for returning water vapor back to the atmosphere through evapotranspiration, so when they are gone, the rains come less frequently. - A larger percentage of the nutrients in a tropical rain forest system are stored in the trees themselves than in temperate forests. - Almost all tropical rain forest species are wind-pollinated, which is less reliable than insect-pollination so tree reproduction is affected more by “chance.”arrow_forwardsupport or refute the following statements based on what you learned about energy flow, biogeochemical cycling, decomposition, trophic levels, and keystone species. You may add a diagram or illustration to support your answer. Planting mangroves is better than putting dolomite sand on the coast of the polluted Manila Bay.arrow_forwardDeforestation has contributed to erosion and dramatic flooding, particularly in parts of Asia. is this statement true or falsearrow_forward
- In which forest biome does the canopy permit low light penetration, and as a result, understory is limited.arrow_forwardINTERTRET DATA Scientists have compiled databases of large forest wildfires in the western United States and compared them to climate and land-surface data. Examine the graph showing wildfire frequency compared to average springsummer temperature. Do you see a correlation? If so, describe it. Based on these data, do you think that climate warming is causing more wildfires? Explain your answer.arrow_forwardForests of the northeastern and middle Atlantic United States, which have broad-leaf hardwood trees that lose their foliage annually, are called (a) temperate deciduous forests (b) tropical dry forests (c) boreal forests (d) temperate rain forests (e) tropical rain forestsarrow_forward
- INTERPRET DATA Examine Figure 56-1. What is the lowest average annual precipitation characteristic of tropical rain forests? the highest? What is the range of average temperature in tropical rain forests? Figure 56-1 Using precipitation and temperature to identify biomes Factors such as soil type, fire, and seasonality of climate affect whether temperate grassland or chaparral develops. Adapted from R.H. Whittaker, Communities and Ecosystems, 2nd ed. (Macmillan, New York, 1975).arrow_forwardWhat are two reasons for deforestation in tropical rain forests? What is the main reason for deforestation of boreal forests?arrow_forwardThe following age and volume data are for a stand of trees Age(yrs) Volume (cubic units) 10 8 20 20 30 38 40 59 50 77 60 92 70 101 How would you estimate the best biological rotation age? If there is a difference between optimal biologic rotation and economic rotation age, explain why. Where does the growth rate peak?arrow_forward
 Biology: The Unity and Diversity of Life (MindTap...BiologyISBN:9781305073951Author:Cecie Starr, Ralph Taggart, Christine Evers, Lisa StarrPublisher:Cengage Learning
 Biology: The Unity and Diversity of Life (MindTap...BiologyISBN:9781337408332Author:Cecie Starr, Ralph Taggart, Christine Evers, Lisa StarrPublisher:Cengage Learning
 Biology (MindTap Course List)BiologyISBN:9781337392938Author:Eldra Solomon, Charles Martin, Diana W. Martin, Linda R. BergPublisher:Cengage Learning
 Biology: The Dynamic Science (MindTap Course List)BiologyISBN:9781305389892Author:Peter J. Russell, Paul E. Hertz, Beverly McMillanPublisher:Cengage Learning
 Human Biology (MindTap Course List)BiologyISBN:9781305112100Author:Cecie Starr, Beverly McMillanPublisher:Cengage Learning
 Biology Today and Tomorrow without Physiology (Mi...BiologyISBN:9781305117396Author:Cecie Starr, Christine Evers, Lisa StarrPublisher:Cengage Learning