
Concept explainers
Videos
a)
To explain the about the regression.
a)
Explanation of Solution
Given:

The regression equation is,
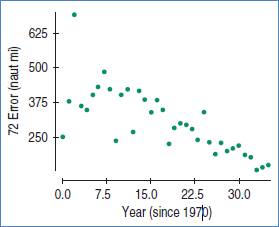
On average, the error made when predicting the path of the hurricanes is 453.223 nautical miles in the year 1970. The error made when predicting the path of the hurricanes decreases on average by 8.37084 nautical miles per year.
b)
To state the hypotheses about the slope.
b)
Answer to Problem 1E
Explanation of Solution
Given:


The null and alternative hypotheses:
c)
To perform the hypothesis test.
c)
Answer to Problem 1E
There is sufficient evidence that the prediction error change over the years.
Explanation of Solution
Given:


Formula:
Test statistic:
The null and alternative hypotheses:
Test statistic:
The degrees of freedom = df = 34
Therefore, p-value would be,
P-value = 0 …Using excel formula, =TDIST(6.9238,34,2)
Decision: P-value < 0.05, reject H0.
Conclusion: There is sufficient evidence that the prediction error change over the years.
d)
To explain R-square.
d)
Answer to Problem 1E
The 58.5% of the variation between Years since 1970 and 72 Error has been explained by the regression model.
Explanation of Solution
Given:

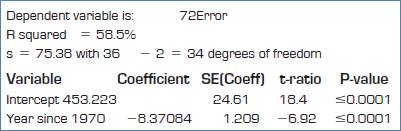
Therefore, 58.5% of the variation between Years since 1970 and 72 Error has been explained by the regression model.
Want to see more full solutions like this?
Chapter 27 Solutions
Stats: Modeling the World Nasta Edition Grades 9-12
Additional Math Textbook Solutions
Basic Business Statistics, Student Value Edition (13th Edition)
Elementary Statistics: Picturing the World (6th Edition)
Statistics: The Art and Science of Learning from Data (4th Edition)
Statistical Reasoning for Everyday Life (5th Edition)
Elementary Statistics (13th Edition)


 MATLAB: An Introduction with ApplicationsStatisticsISBN:9781119256830Author:Amos GilatPublisher:John Wiley & Sons Inc
 Probability and Statistics for Engineering and th...StatisticsISBN:9781305251809Author:Jay L. DevorePublisher:Cengage Learning
 Statistics for The Behavioral Sciences (MindTap C...StatisticsISBN:9781305504912Author:Frederick J Gravetter, Larry B. WallnauPublisher:Cengage Learning
 Elementary Statistics: Picturing the World (7th E...StatisticsISBN:9780134683416Author:Ron Larson, Betsy FarberPublisher:PEARSON
 The Basic Practice of StatisticsStatisticsISBN:9781319042578Author:David S. Moore, William I. Notz, Michael A. FlignerPublisher:W. H. Freeman
 Introduction to the Practice of StatisticsStatisticsISBN:9781319013387Author:David S. Moore, George P. McCabe, Bruce A. CraigPublisher:W. H. Freeman