
Financial And Managerial Accounting
15th Edition
ISBN: 9781337902663
Author: WARREN, Carl S.
Publisher: Cengage Learning,
expand_more
expand_more
format_list_bulleted
Videos
Textbook Question
Chapter 27, Problem 3TIF
Communication
Ethan Fromme, the chief financial officer of Maximal Inc., has asked for your help in interpreting the company’s operating performance. He has provided you with the following three performance graphs for the most recent fiscal year.
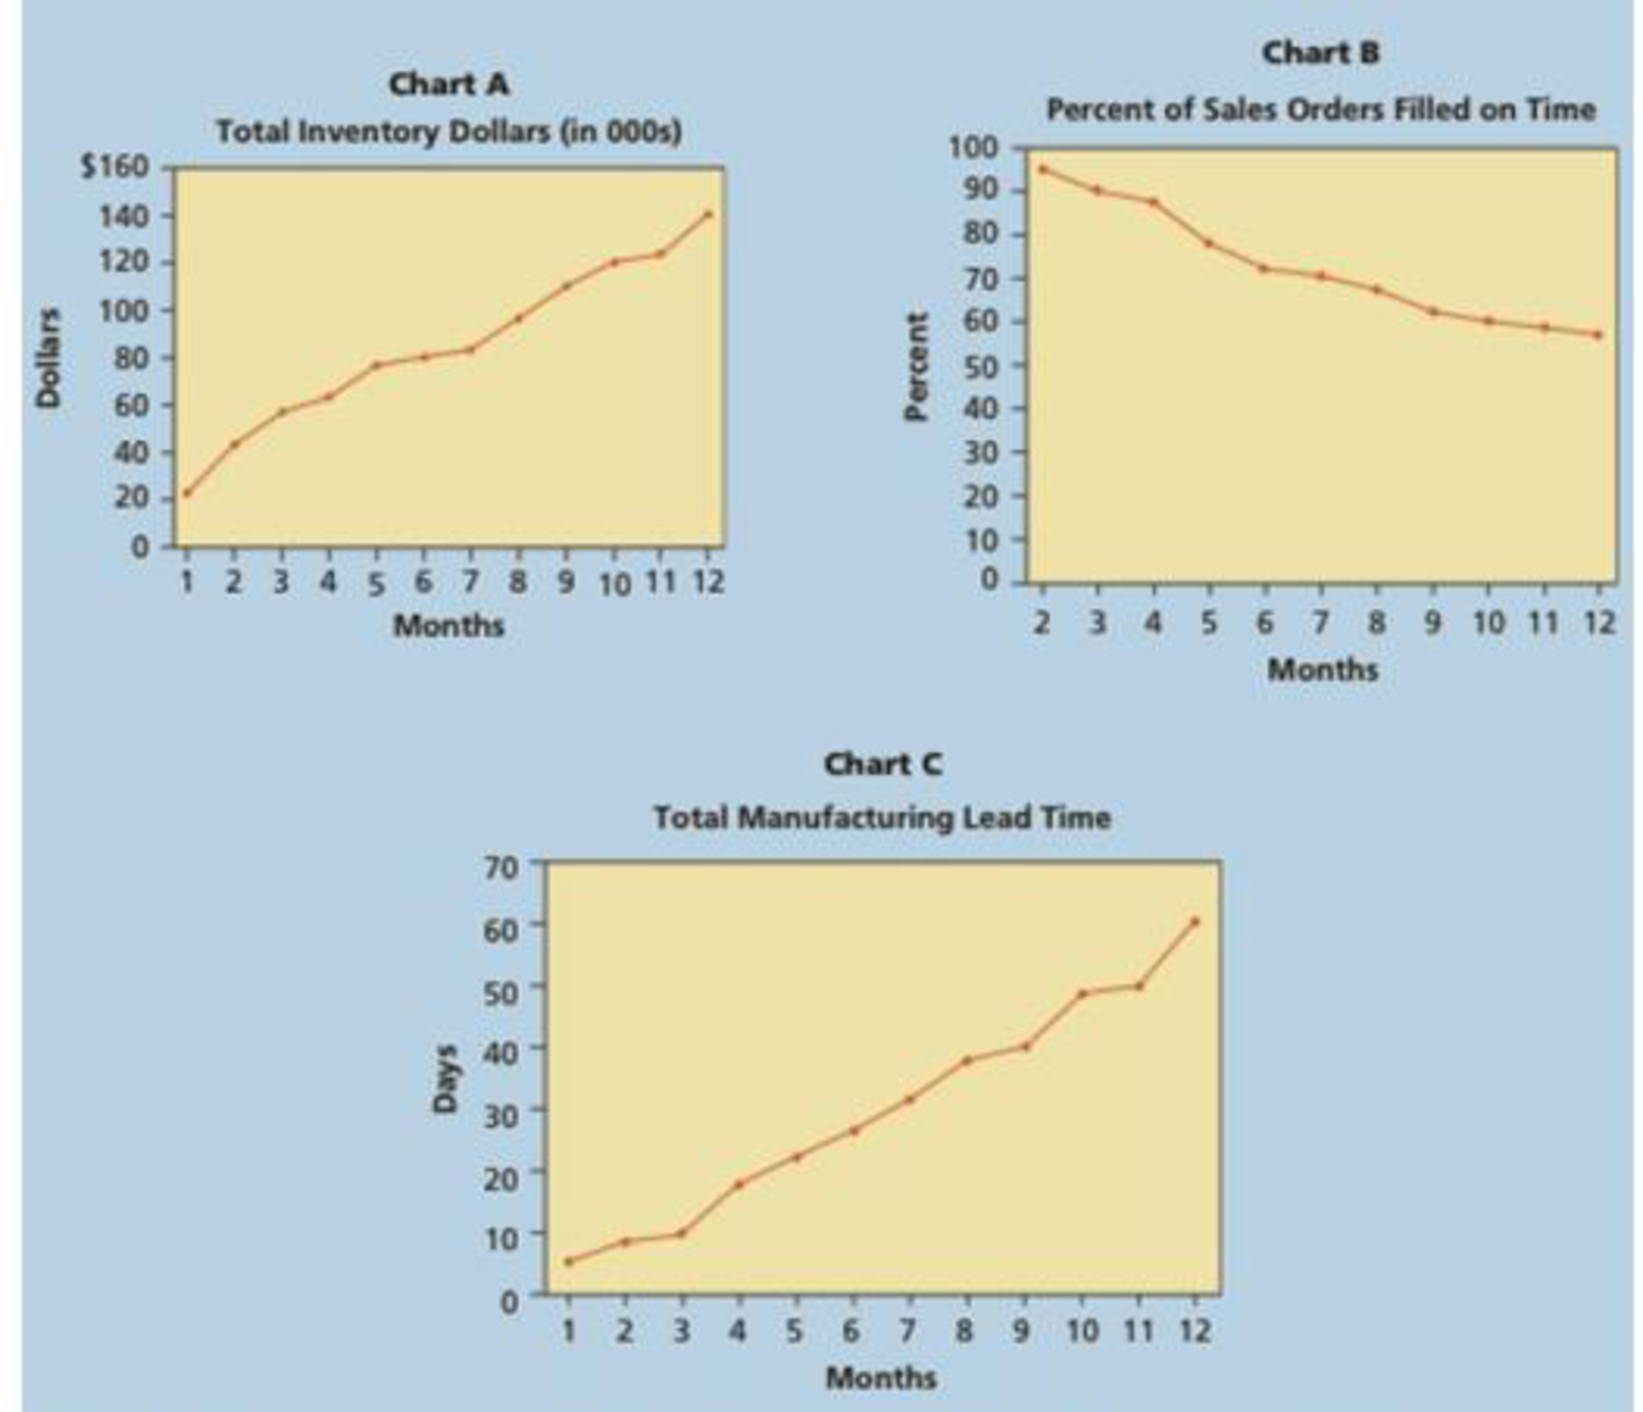
Based on the information in these graphs, write a brief memo to Mr. Fromme, evaluating the company’s ability to produce high-quality products at a low cost with a fast response time and immediate availability.
Expert Solution & Answer

Trending nowThis is a popular solution!

Students have asked these similar questions
Describing the balanced scorecard and identifying key performance indicators for each perspective
Consider the following key performance indicators, and classify each indicator according to the balanced scorecard perspective it addresses. Choose from the financial perspective, customer perspective, internal business perspective, and the learning and growth perspective.
Number of customer complaints
Number of information system upgrades completed
Residual income
New product development time
Employee turnover rate
Percentage of products with online help manuals
Customer retention
Percentage of compensation based on performance
Percentage of orders filled each week
Gross margin growth
Number of new patents
Employee satisfaction ratings
Manufacturing cycle time (average length of the production process)
Earnings growth
Average machine setup time
Number of new customers
Employee promotion rate
Cash flow from operations
Customer satisfaction ratings
Machine downtime
Finished products per…
Assume service scores for the area you manage, Harrah’s Metropolis hotel housekeeping, have declined over the past year. As part of the LEAN rollout at Metropolis, you and some of your front-line employees will participate in a kaizen event focused on improving guest-room housekeeping operations. What KPIs (key performance indicators) would you propose to track to determine whether the changes implemented through the kaizen effort actually improve performance?
Balanced Scorecard; Strategy Map The following are critical success factors for Dell Inc:∙ Product manufacturing time∙ Customer perception of order-taking convenience and accuracy∙ Revenue growth∙ Selling expense to sales ratio∙ Number of new manufacturing processes developed∙ Order processing time∙ Materials inventory∙ Training dollars per employee∙ Number of emerging technologies evaluated∙ Customer retention∙ Manufacturing defects∙ Number of new manufacturing processes under development∙ Customer satisfaction with speed of service∙ Gross margin∙ Operating cost ratioRequired1. Using the four BSC perspectives (learning and growth, internal processes, customer satisfaction, andfinancial), sort these CSFs into the appropriate perspective.2. Create a simple strategy map for Dell.
Chapter 27 Solutions
Financial And Managerial Accounting
Ch. 27 - What is the benefit of the lean philosophy?Ch. 27 - What are some examples of non-value-added lead...Ch. 27 - Why is a product-oriented layout preferred by lean...Ch. 27 - How is setup time related to lead time?Ch. 27 - Why do lean manufacturers favor pull or make to...Ch. 27 - Why would a lean manufacturer strive to produce...Ch. 27 - How is supply chain management different from...Ch. 27 - Why does lean accounting result in fewer...Ch. 27 - Why do lean manufacturers use a raw and in process...Ch. 27 - Why is the direct labor cost category eliminated...
Ch. 27 - Prob. 11DQCh. 27 - What is the benefit of identifying non-value-added...Ch. 27 - In what ways can the cost of a process be...Ch. 27 - Lead time Blues Inc. manufactures jeans in the...Ch. 27 - Prob. 2BECh. 27 - Lean accounting The annual budgeted conversion...Ch. 27 - Cost of quality report A quality control activity...Ch. 27 - Process activity analysis Roen Company incurred an...Ch. 27 - Lean principles The chief executive officer (CEO)...Ch. 27 - Prob. 2ECh. 27 - Lean principles Rag Swag Inc. manufactures various...Ch. 27 - Lead time analysis Furry Friends Inc. manufactures...Ch. 27 - Reduce setup time Vernon Inc. has analyzed the...Ch. 27 - Compute lead time Jackson Fabricators Inc....Ch. 27 - Calculate lead time Williams Optical Inc. is...Ch. 27 - Suppy chain management The following is an excerpt...Ch. 27 - Employee involvement Quickie Designs Inc. uses...Ch. 27 - Lean principles for a restaurant The management of...Ch. 27 - Accounting issues in a lean environment Eon...Ch. 27 - Lean accounting Westgate Inc. uses a lean...Ch. 27 - Lean accounting Modern Lighting Inc. manufactures...Ch. 27 - Lean accounting Vintage Audio Inc. manufactures...Ch. 27 - Pareto chart Meagher Solutions Inc. manufactures...Ch. 27 - Cost of quality report A. Using the information in...Ch. 27 - Pareto chart for a service company Three Rivers...Ch. 27 - Cost of quality and value-added/non-value-added...Ch. 27 - Process activity analysis The Brite Beverage...Ch. 27 - Process activity analysis for a service company...Ch. 27 - Prob. 21ECh. 27 - Lean principles Bright Night, Inc., manufactures...Ch. 27 - Lead time Sound Tek Inc. manufactures electronic...Ch. 27 - Lean accounting Dashboard Inc. manufactures and...Ch. 27 - Pareto chart and cost of quality report for a...Ch. 27 - Prob. 1PBCh. 27 - Lead time Master Chef Appliance Company...Ch. 27 - Lean accounting Com-Tel Inc. manufactures and...Ch. 27 - Pareto chart and cost of quality report for a...Ch. 27 - Make a Decision Lean Performance for...Ch. 27 - Prob. 2MADCh. 27 - Prob. 3MADCh. 27 - Prob. 4MADCh. 27 - Ethics in Action In August, Lannister Company...Ch. 27 - Communication Ethan Fromme, the chief financial...Ch. 27 - Leese Inc. has the following quality financial...Ch. 27 - When measuring the cost of quality, the cost of...Ch. 27 - In measuring the cost of quality, which one of the...Ch. 27 - External failure costs include all of the...
Knowledge Booster


Learn more about
Need a deep-dive on the concept behind this application? Look no further. Learn more about this topic, accounting and related others by exploring similar questions and additional content below.Similar questions
- The controller of Emery, Inc. has computed quality costs as a percentage of sales for the past 5 years (20X1 was the first year the company implemented a quality improvement program). This information is as follows: Required: 1. Prepare a trend graph for total quality costs. Comment on what the graph has to say about the success of the quality improvement program. 2. Prepare a graph that shows the trend for each quality cost category. What does the graph have to say about the success of the quality improvement program? Does this graph supply more insight than the total cost trend graph does? 3. Prepare a graph that compares the trend in relative control costs versus relative failure costs. Comment on the significance of this trend.arrow_forwardHyperflash Inc. has a balanced scorecard that includes the following relationships: Actual results for this month and last month are as follows: Instructions 1.Analyze these data to verify whether they support the expected relationship between the strategic objectives and performance metrics. 2.Identify three possible reasons for any unsupported relationship you identified in part (1). 3.Which of the three possibilities you identified in part (2) is the most likely reason for the unsupported relationship you identified in part (1)?arrow_forwardCarson Wellington, president of Mallory Plastics, was considering a report sent to him by Emily Sorensen, vice president of operations. The report was a summary of the progress made by an activity-based management system that was implemented three years ago. Significant progress had indeed been realized. At the conclusion of the report, Emily urged Carson to consider the adoption of the Balanced Scorecard as a logical next step in the companys efforts to establish itself as a leader in its industry. Emily clearly was impressed by the Balanced Scorecard and intrigued by the possibility that the change would enhance the overall competitiveness of Mallory. She requested a meeting of the executive committee to explain the similarities and differences between the two approaches. Carson agreed to schedule the meeting but asked Emily to prepare a memo in advance, listing the most important similarities and differences between the two approaches to responsibility accounting. Required: Prepare the memo requested by Carson.arrow_forward
- Q) Duncan's Pizzas is a chain of pizza stores. Pizzas are made fresh in-store, and then delivered to customers by a fleet of drivers. The senior management team has identified the strategic priorities for the business as on-time delivery and product quality. Required: a) For each of the strategic priorities, suggest three performance measures and explain it in details. b) If the company is successful in achieving challenging targets for these performance measures, will it also necessarily achieve high profitability? Explain your answer.arrow_forwardMeasure Maps Silver Lining Inc. has a balanced scorecard with a strategy map that shows that delivery time and the number of erroneous shipments are expected to affect the company’s ability to satisfy the customer. Further, the strategy map for the balanced scorecard shows that the hours from ordered to delivered affects the percentage of customers who shop again, and the number of erroneous shipments affects the online customer satisfaction rating. The following information is also available: The company’s target hours from ordered to delivered is 20. Every hour over the ordered-to-delivered target results in a 0.5% decrease in the percentage of customers who shop again. The company’s target number of erroneous shipments per year is no more than 70. Every error over the erroneous shipments target results in a 0.05 point decrease in the online customer satisfaction rating and an added future financial loss of $500. The company estimates that for every 1% decrease in the percentage of…arrow_forwardMeasure Maps Silver Lining Inc. has a balanced scorecard with a strategy map that shows that delivery time and the number of erroneous shipments are expected to affect the company’s ability to satisfy the customer. Further, the strategy map for the balanced scorecard shows that the hours from ordered to delivered affects the percentage of customers who shop again, and the number of erroneous shipments affects the online customer satisfaction rating. The following information is also available: The company’s target hours from ordered to delivered is 20. Every hour over the ordered-to-delivered target results in a 0.5% decrease in the percentage of customers who shop again. The company’s target number of erroneous shipments per year is no more than 55. Every error over the erroneous shipments target results in a 0.5 point decrease in the online customer satisfaction rating and an added future financial loss of $800. The company estimates that for every 1% decrease in the percentage of…arrow_forward
- From the following list of performance measures, label each one as Financial, Customer, Internal Business Processes, or Learning and Growth: Percentage of on-time deliveries Employee turnover ratio Revenue from new products Number of new customers Percentage of compensation based on team performance Percentage of products returned Operating income Time taken to replace defective productsarrow_forwardRizzo Goal Inc. produces and sells hockey equipment, often custom made for online orders. The company has the following performance metrics on its balanced scorecard: days from ordered to delivered, number of shipping errors, customer retention rate, and market share. A measure map illustrates that the days from ordered to delivered and the number of shipping errors are both expected to directly affect the customer retention rate, which affects market share. Additional internal analysis finds that: Every shipping error over three shipping errors per month reduces the customer retention rate by 1.5%. On average, each day above three days from ordered to delivered yields a reduction in the customer retention rate of 1%. Each day before three days from order to delivery yields an increase in the customer retention rate of 1%, on average. Rizzo Goal Inc.s current customer retention rate is 60%. The company estimates that for every 1% increase or decrease in the customer retention rate, market share changes 0.5% in the same direction. Rizzo Goal Inc.s current market share is 21.4%. Ignoring any other factors, if the company has six shipping errors this month and an average of 3.5 days from ordered to delivered, determine (a) the new customer retention rate and (b) the new market share that Rizzo Goal Inc. expects to have.arrow_forwardEye Swear Inc. has a balanced scorecard that includes the following relationships: Actual results for this year and last year are as follows: Instructions 1.Analyze these statistics to verify whether they support the expected relationships between the strategic objectives and performance metrics. 2.Identify three possible reasons for any unsupported relationship you identified in part (1). 3.Which of the three possibilities you identified in part (2) is the most likely reason for the unsupported relationship you identified in part (1)?arrow_forward
- Ross Company implemented a quality improvement program and tracked the following for the five years: By cost category as a percentage of sales for the same period of time: Required: 1. Prepare a bar graph that reveals the trend in quality cost as a percentage of sales (time on the horizontal axis and percentages on the vertical). Comment on the message of the graph. 2. Prepare a bar graph for each cost category as a percentage of sales. What does this graph tell you? 3. What if management would like to have the trend in relative distribution of quality costs? Express this as a bar graph and comment on its significance.arrow_forwardAt the end of 20x1, Mejorar Company implemented a low-cost strategy to improve its competitive position. Its objective was to become the low-cost producer in its industry. A Balanced Scorecard was developed to guide the company toward this objective. To lower costs, Mejorar undertook a number of improvement activities such as JIT production, total quality management, and activity-based management. Now, after two years of operation, the president of Mejorar wants some assessment of the achievements. To help provide this assessment, the following information on one product has been gathered: Required: 1. Compute the following measures for 20x1 and 20x3: a. Actual velocity and cycle time b. Percentage of total revenue from new customers (assume one unit per customer) c. Percentage of very satisfied customers (assume each customer purchases one unit) d. Market share e. Percentage change in actual product cost (for 20x3 only) f. Percentage change in days of inventory (for 20x3 only) g. Defective units as a percentage of total units produced h. Total hours of training i. Suggestions per production worker j. Total revenue k. Number of new customers 2. For the measures listed in Requirement 1, list likely strategic objectives, classified according to the four Balance Scorecard perspectives. Assume there is one measure per objective.arrow_forward
arrow_back_ios
arrow_forward_ios
Recommended textbooks for you
 Managerial AccountingAccountingISBN:9781337912020Author:Carl Warren, Ph.d. Cma William B. TaylerPublisher:South-Western College PubFinancial And Managerial AccountingAccountingISBN:9781337902663Author:WARREN, Carl S.Publisher:Cengage Learning,
 Managerial Accounting: The Cornerstone of Busines...AccountingISBN:9781337115773Author:Maryanne M. Mowen, Don R. Hansen, Dan L. HeitgerPublisher:Cengage Learning
 Cornerstones of Cost Management (Cornerstones Ser...AccountingISBN:9781305970663Author:Don R. Hansen, Maryanne M. MowenPublisher:Cengage Learning
 Principles of Cost AccountingAccountingISBN:9781305087408Author:Edward J. Vanderbeck, Maria R. MitchellPublisher:Cengage Learning
Managerial Accounting
Accounting
ISBN:9781337912020
Author:Carl Warren, Ph.d. Cma William B. Tayler
Publisher:South-Western College Pub
Financial And Managerial Accounting
Accounting
ISBN:9781337902663
Author:WARREN, Carl S.
Publisher:Cengage Learning,
Managerial Accounting: The Cornerstone of Busines...
Accounting
ISBN:9781337115773
Author:Maryanne M. Mowen, Don R. Hansen, Dan L. Heitger
Publisher:Cengage Learning
Cornerstones of Cost Management (Cornerstones Ser...
Accounting
ISBN:9781305970663
Author:Don R. Hansen, Maryanne M. Mowen
Publisher:Cengage Learning
Principles of Cost Accounting
Accounting
ISBN:9781305087408
Author:Edward J. Vanderbeck, Maria R. Mitchell
Publisher:Cengage Learning
What is Business Analysis?; Author: WolvesAndFinance;https://www.youtube.com/watch?v=gG2WpW3sr6k;License: Standard Youtube License