
Concept explainers
Videos
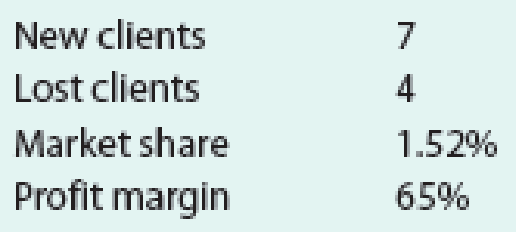
Blake & McKenzie Tax Services is a company serving 72 clients (as of the beginning of last month) that is working on reorganizing its balanced scorecard. Currently, the company has the following performance metrics: online client satisfaction rating, client growth percentage (the number of total clients at the beginning of the current month compared to the number of total clients at the beginning of the prior month), market share, and profit margin. The company tracks these metrics from month to month. The company’s target client growth percentage is 4% per month. Its target average online client satisfaction rating is 4.8 stars. Last month, the company noted the following data related to these metrics:
- a. Working together in teams, create strategic objectives that each of the company’s four performance metrics might represent.
- b. Determine whether the company achieved its client growth percentage target last month.
- c. Suppose that last month, the company received 55 five-star reviews, 10 four-star reviews, 3 three-star reviews, 1 two-star review, and 1 one-star review (some clients did not submit a review). Determine whether the company met its average online client satisfaction rating target.
- d. Come up with at least one strategic initiative for the strategic objective of any performance metric target that you know the company did not meet last month.

Trending nowThis is a popular solution!

Chapter 28 Solutions
Financial And Managerial Accounting


- 72 Inc. has developed a balanced scorecard with the following performance metrics: Total sales Employee turnover Market share Number of shipping errors Median training hours per employee Number of new customers Relative to the metric customer satisfaction ratings, which of these performance metrics are leading indicators and which are lagging indicators?arrow_forwardForchen, Inc., provided the following information for two of its divisions for last year: Required: 1. For the Small Appliances Division, calculate: a. Average operating assets b. Margin c. Turnover d. Return on investment (ROI) 2. For the Cleaning Products Division, calculate: a. Average operating assets b. Margin c. Turnover d. Return on investment (ROI) 3. What if operating income for the Small Appliances Division was 2,000,000? How would that affect average operating assets? Margin? Turnover? ROI? Calculate any changed ratios (round to four significant digits).arrow_forwardRoss Company implemented a quality improvement program and tracked the following for the five years: By cost category as a percentage of sales for the same period of time: Required: 1. Prepare a bar graph that reveals the trend in quality cost as a percentage of sales (time on the horizontal axis and percentages on the vertical). Comment on the message of the graph. 2. Prepare a bar graph for each cost category as a percentage of sales. What does this graph tell you? 3. What if management would like to have the trend in relative distribution of quality costs? Express this as a bar graph and comment on its significance.arrow_forward
- The following table shows monthly revenue for six different web development companies. a. Use Excel to create sparklines for sales at each company. b. Which companies have generally decreasing revenues over the six months? Which company has exhibited the most consistent growth over the six months? Which companies have revenues that are both increasing and decreasing over the six months? c. Use Excel to create a heat map for the revenue of the six companies. Do you find the heat map or the sparklines to be better at communicating the trend of revenues over the six months for each company? Why?arrow_forwardThe following revenue data were taken from the December 31, 2017, General Electric annual report (10-K): For each segment and each year, calculate intersegment sales (another name for transfer sales) as a percentage of total sales. Using Microsoft Excel or another spreadsheet application, create a clustered column graph to show the 2016 and 2017 percentages for each division. Comment on your observations of this data. How might a division sales manager use this data?arrow_forwardThe controller of Emery, Inc. has computed quality costs as a percentage of sales for the past 5 years (20X1 was the first year the company implemented a quality improvement program). This information is as follows: Required: 1. Prepare a trend graph for total quality costs. Comment on what the graph has to say about the success of the quality improvement program. 2. Prepare a graph that shows the trend for each quality cost category. What does the graph have to say about the success of the quality improvement program? Does this graph supply more insight than the total cost trend graph does? 3. Prepare a graph that compares the trend in relative control costs versus relative failure costs. Comment on the significance of this trend.arrow_forward
- Jarriot, Inc., presented two years of data for its Furniture Division and its Houseware Division. Required: 1. Compute the ROI and the margin and turnover ratios for each year for the Furniture Division. (Round your answers to four significant digits.) 2. Compute the ROI and the margin and turnover ratios for each year for the Houseware Division. (Round your answers to four significant digits.) 3. Explain the change in ROI from Year 1 to Year 2 for each division.arrow_forwardBrookbury Accounting completed 150 tax returns in the month of March. Its Effective Capacity is 170 tax returns and its Design Capacity is 175 tax returns. Calculate the Efficiency and Utilization for Brookbury Accounting. What do these two numbers tell you?arrow_forwardThe Clothes Clutch, a retail clothier, has had average sales of $400,000 for the last five years, 2018-2022. The firm's total assets at the end of 2020 were $400,000. An internal staff cost analyst has prepared the following financial data from the annual reports. You have been hired as a consultant to help analyze the financial position. 2022 2021 2020 2019 2018 Current Ratio 2.80 2.43 2.36 2.10 2.00 Acid Test Ratio 2.03 1.93 1.82 1.61 1.47 Days' Sales in Receivables 61 58 54 42 35 Merchandise Inventory Turnover 4.20 4.10 4.10 3.90 3.70 Debt Ratio 0.48 0.50 0.49 0.47 0.47 Times Interest Earned 4.60 4.80 5.90 5.70 6.00 Sales as a Percent of 1996 Sales 1.46 1.23 1.12 1.06 1.00 Net Income as a Percent of 1998 Income 1.31 1.20 1.10 1.06 1.00 Gross Profit Margin 38.5% 38.8% 38.9% 40.0% 39.7% Operating Expenses to Net Sales 11.4% 11.3% 11.5% 11.4% 11.7% Net Profit Margin 7.6% 8.6% 8.9% 9.4% 9.3% Return on Total Assets…arrow_forward
- Toronto Business Associates, a division of Maple Leaf Services Corporation, offers management and computer consulting services to clients throughout Canada and the northwestern United States. The division specializes in website development and other Internet applications. The corporate management at Maple Leaf Services is pleased with the performance of Toronto Business Associates for the first nine months of the current year and has recommended that the division manager, Richard Howell, submit a revised forecast for the remaining quarter, as the division has exceeded the annual plan year-to-date by 20 percent of operating income. An unexpected increase in billed hour volume over the original plan is the main reason for this increase in income. The original operating budget for the first three quarters for Toronto Business Associates follows. TORONTO BUSINESS ASSOCIATES 20x1 Operating Budget 1st Quarter 2nd Quarter 3rd Quarter Total for FirstThree Quarters Revenue:…arrow_forwardmanagement consulting firm has four types of professionals on on its staff: Managing consultants, senior associates, field and and office staff. Average rates charged to consulting clients for work of each of these professionals categories are k3150/hour, k1680/hour, k1260/hour and k630/hour respectively. Office records indicate the following number of hours billed last year in each category: 8000, 14000, 24000 and 35000, respectively. If the firm is trying to come up with an average billing rate for estimating client charges for next year, what would you suggest they do and what do you think is the appropriate rate?arrow_forwardMark Fletcher, President of SoftGro, Inc., was looking forward to seeing the performance reports for November because he knew the company's sales for the month had exceeded budget by a considerable margin. SoftGro, a distributor of educational software packages, has been growing steadily for approximately two years. Fletcher's biggest challenge at this point was to ensure that the company did not lose control of expenses during this growth period. When Fletcher received the November reports, he was dismayed to see the large unfavorable variance in the company's Monthly Selling expense Report that follows: Annual Budget November Budget November Actual November Variance Unit sales 2,000,000 280,000 310,000 30,000 Dollar sales $ 80,000,000.00 $ 11,200,000.00 $ 12,400,000.00 $ 1,200,000.00 Orders processed 54,000 6,500 5,800 -700 Sales personnel per month 90 90 96 -6 Advertising $ 19,800,000.00 $…arrow_forward
 Managerial AccountingAccountingISBN:9781337912020Author:Carl Warren, Ph.d. Cma William B. TaylerPublisher:South-Western College PubFinancial And Managerial AccountingAccountingISBN:9781337902663Author:WARREN, Carl S.Publisher:Cengage Learning,
 Essentials of Business Analytics (MindTap Course ...StatisticsISBN:9781305627734Author:Jeffrey D. Camm, James J. Cochran, Michael J. Fry, Jeffrey W. Ohlmann, David R. AndersonPublisher:Cengage Learning
 Cornerstones of Cost Management (Cornerstones Ser...AccountingISBN:9781305970663Author:Don R. Hansen, Maryanne M. MowenPublisher:Cengage Learning
 Principles of Accounting Volume 2AccountingISBN:9781947172609Author:OpenStaxPublisher:OpenStax College
 Managerial Accounting: The Cornerstone of Busines...AccountingISBN:9781337115773Author:Maryanne M. Mowen, Don R. Hansen, Dan L. HeitgerPublisher:Cengage Learning