Essential Statistics
2nd Edition
ISBN: 9781259570643
Author: Navidi
Publisher: MCG
bartleby

Videos

Question
Book Icon
Chapter 3, Problem 15RE

a.

To determine

Find the first and the third quartiles.

a.

Expert Solution
Check Mark

Answer to Problem 15RE

The first and the third quartiles are 2.1 and 15.7 respectively.

Explanation of Solution

Calculation:

The profit of 15 largest U.S. Corporation is given.

Three quartiles:

  • The first quartile separates the lowest 25% of the observations from the other 75% of the observations. The first quartile is denoted by Q1.
  • The second quartile separates the lower 50% of the observations from the other 50% of the observations. The second quartile is denoted by Q2. The second quartile is same as median.
  • The third quartile separates the lowest 75% of the observations from the other 25% of the observations. The third quartile is denoted by Q3.
  • Procedure for finding the first and the third quartile:
  • Step 1: The observations should be arranged in increasing order.
  • Step 2: The size of the data is n.
  •                                     For finding first quartile, L=0.25n
  •                                     For finding third quartile, L=0.75n
  • Step 3: The quartile will be the average of the observation of the position L and the observation in position L+1, if L is a whole number. If the L value is not a whole number, the next higher whole number will be considered. The quartile is the observation in the position of rounded-up value.
  • The observations are arranged in increasing order:
  • {16.9,1.2,1.5,2.1,2.4,3.9,7.1,9.2,10.2,12.4,14.2,15.7,20.2,26.9,41.1}
  • The size of the data is n=15.
  • For finding first quartile,
  •  L=0.25×15=3.75
  • Here, 3.75 is not a whole number, hence the 1st quartile will be the observation in the 4th position.
  • From the arranged observations the first quartile is 2.1.
  • For finding third quartile,
  • L=0.75×15=11.25
  • Here, 11.25 is not a whole number, hence the 3rd quartile will be the observation in the 12th position.
  • From the arranged observations the third quartile is 15.7.

Hence, the first and the third quartiles are 2.1 and 15.7 respectively.

b.

To determine

Find the median of the data.

b.

Expert Solution
Check Mark

Answer to Problem 15RE

The median amount spent on advertising is 9.2.

Explanation of Solution

Calculation:

Median:

Let x1,x2...xn be n values.

The steps for finding the median:

  • The all data values should be arranged in ascending order.
  • If the total number of data values, n is odd, then the median will be the middle value or if n is even, then the median will be the average of middle two values.
  • The observations are arranged in increasing order:
  • {16.9,1.2,1.5,2.1,2.4,3.9,7.1,9.2,10.2,12.4,14.2,15.7,20.2,26.9,41.1}
  • The size of the data is n=15.
  • Hence, the sample size is odd. Therefore, the median is the middle value that is 8th observation.
  • From the arranged observations the median is 9.2.

Thus, the median of the data is 9.2.

c.

To determine

Find the upper and lower outlier boundaries.

c.

Expert Solution
Check Mark

Answer to Problem 15RE

The upper and lower outlier boundaries are –18.3 and 36.1 respectively.

Explanation of Solution

Calculation:

Interquartile range:

  • The interquartile range is the difference between the third quartile and first quartile. For detecting outlier this measure can be used.
  • Interquartile range can be found as, IQR=Q3Q1. Where, the first quartile is denoted by Q1 and third quartile is denoted by Q3.
  • From part (a), the first and the third quartiles are 2.1 and 15.7 respectively.
  • Substitute these values in the interquartile range formula,
  • IQR=15.72.1=13.6
  • Outlier boundaries:
  • Lower outlier boundary is Q11.5×IQR.
  • Upper outlier boundary is Q3+1.5×IQR.
  • Where, the first quartile is denoted by Q1 and third quartile is denoted by Q3.
  • Substitute these values in the formulae,
  • Lower outlier boundary=2.11.5×13.6=2.120.4=18.3.
  •  Upper outlier boundary=15.7+(1.5×13.7)=15.7+20.4=36.1

Thus, the upper and lower outlier boundaries are –18.3 and 36.1 respectively.

d.

To determine

Find the outliers.

d.

Expert Solution
Check Mark

Answer to Problem 15RE

There is one outliers in the data and is 41.1.

Explanation of Solution

Calculation:

  • Condition for outlier:
  • If any observation is less than the lower outlier boundary, the observation will be outlier.
  • If any observation is greater than the upper outlier boundary, the observation will be outlier.

From part (c), the upper and lower outlier boundaries are –18.3 and 36.1 respectively.

There is one observation which is greater than the upper outlier boundary that is, 41.1>36.1.

Other observations are greater than the lower outlier boundary and less than the upper outlier boundary.

Hence, there is one outliers in the data.

e.

To determine

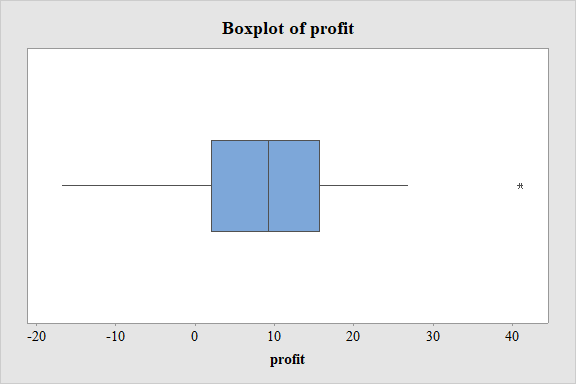
Draw a boxplot of the data.

e.

Expert Solution
Check Mark

Answer to Problem 15RE

The boxplot is given below,

Essential Statistics, Chapter 3, Problem 15RE , additional homework tip  1

Explanation of Solution

Calculation:

  • Boxplot:

Software procedure:

  • Step-by-step procedure to draw a boxplot using the MINITAB software:
  • Choose Graph > Boxplot.
  • Choose Simple. Click OK.
  • In Graph variables, enter the data of profit..
  • Click OK.

Output using the MINITAB software is given below:

Essential Statistics, Chapter 3, Problem 15RE , additional homework tip  2

  • From the MINITAB output, it is clear that there is one outlier in the data.

Want to see more full solutions like this?

Subscribe now to access step-by-step solutions to millions of textbook problems written by subject matter experts!

Chapter 3 Solutions

Essential Statistics

Ch. 3.1 - Prob. 11ECh. 3.1 - Prob. 12ECh. 3.1 - Prob. 13ECh. 3.1 - Prob. 14ECh. 3.1 - Prob. 15ECh. 3.1 - Prob. 16ECh. 3.1 - Prob. 17ECh. 3.1 - 18. Find the mean, median, and mode for the...Ch. 3.1 - Prob. 19ECh. 3.1 - In Exercises 19–22, use the given frequency...Ch. 3.1 - Prob. 21ECh. 3.1 - In Exercises 19–22, use the given frequency...Ch. 3.1 - Prob. 23ECh. 3.1 - Prob. 24ECh. 3.1 - Prob. 25ECh. 3.1 - Prob. 26ECh. 3.1 - Prob. 27ECh. 3.1 - Prob. 28ECh. 3.1 - Prob. 29ECh. 3.1 - 30. Mean and median height: The National Center...Ch. 3.1 - 31. Hamburgers: An ABC News story reported the...Ch. 3.1 - Prob. 32ECh. 3.1 - Prob. 33ECh. 3.1 - Prob. 34ECh. 3.1 - Prob. 35ECh. 3.1 - 36. Beer: The following table presents the number...Ch. 3.1 - Prob. 37ECh. 3.1 - Prob. 38ECh. 3.1 - 39. Heavy football players: Following are the...Ch. 3.1 - Prob. 40ECh. 3.1 - Prob. 41ECh. 3.1 - 42. News flash: The following table presents the...Ch. 3.1 - Prob. 43ECh. 3.1 - Prob. 44ECh. 3.1 - Prob. 45ECh. 3.1 - Prob. 46ECh. 3.1 - Prob. 47ECh. 3.1 - Prob. 48ECh. 3.1 - Prob. 49ECh. 3.1 - Prob. 50ECh. 3.1 - Prob. 51ECh. 3.1 - 52. Sources of news: A sample of 32 U.S. adults...Ch. 3.1 - Prob. 53ECh. 3.1 - Prob. 54ECh. 3.1 - Prob. 55ECh. 3.1 - Prob. 56ECh. 3.1 - Prob. 57ECh. 3.1 - Prob. 58ECh. 3.1 - Prob. 59ECh. 3.1 - Prob. 60ECh. 3.1 - Prob. 61ECh. 3.1 - Prob. 62ECh. 3.1 - Prob. 63ECh. 3.1 - Prob. 64ECh. 3.1 - Prob. 65ECh. 3.1 - Prob. 66ECh. 3.1 - Prob. 67ECh. 3.1 - Prob. 68ECh. 3.1 - Prob. 69ECh. 3.1 - Prob. 70ECh. 3.1 - Prob. 71ECh. 3.1 - Prob. 72ECh. 3.1 - Prob. 73ECh. 3.1 - Prob. 74ECh. 3.2 - 1. Compute the population variance for the St....Ch. 3.2 - Prob. 2CYUCh. 3.2 - Prob. 3CYUCh. 3.2 - Prob. 4CYUCh. 3.2 - Prob. 5CYUCh. 3.2 - Prob. 6CYUCh. 3.2 - Prob. 7CYUCh. 3.2 - Prob. 8CYUCh. 3.2 - Prob. 9ECh. 3.2 - In Exercises 9–12, fill in each blank with the...Ch. 3.2 - Prob. 11ECh. 3.2 - In Exercises 9–12, fill in each blank with the...Ch. 3.2 - Prob. 13ECh. 3.2 - In Exercises 13–16, determine whether the...Ch. 3.2 - Prob. 15ECh. 3.2 - Prob. 16ECh. 3.2 - Prob. 17ECh. 3.2 - 18. Find the sample variance and standard...Ch. 3.2 - Prob. 19ECh. 3.2 - Prob. 20ECh. 3.2 - Prob. 21ECh. 3.2 - Prob. 22ECh. 3.2 - 23. Approximate the sample variance and standard...Ch. 3.2 - 24. Approximate the sample variance and standard...Ch. 3.2 - Prob. 25ECh. 3.2 - Prob. 26ECh. 3.2 - Prob. 27ECh. 3.2 - Prob. 28ECh. 3.2 - Prob. 29ECh. 3.2 - Prob. 30ECh. 3.2 - Prob. 31ECh. 3.2 - Prob. 32ECh. 3.2 - 33. Heavy football players: Following are the...Ch. 3.2 - 34. Beer: The following table presents the number...Ch. 3.2 - Prob. 35ECh. 3.2 - Prob. 36ECh. 3.2 - Prob. 37ECh. 3.2 - Prob. 38ECh. 3.2 - Prob. 39ECh. 3.2 - Prob. 40ECh. 3.2 - Prob. 41ECh. 3.2 - 42. Pay your bills: In a large sample of customer...Ch. 3.2 - Prob. 43ECh. 3.2 - Prob. 44ECh. 3.2 - Prob. 45ECh. 3.2 - 46. Pay your bills: For the data in Exercise 42,...Ch. 3.2 - Prob. 47ECh. 3.2 - 48. Internet providers: For the data in Exercise...Ch. 3.2 - Prob. 49ECh. 3.2 - Prob. 50ECh. 3.2 - Prob. 51ECh. 3.2 - Prob. 52ECh. 3.2 - Prob. 53ECh. 3.2 - Prob. 54ECh. 3.2 - Prob. 55ECh. 3.2 - Prob. 56ECh. 3.2 - Prob. 57ECh. 3.2 - Prob. 58ECh. 3.2 - Prob. 59ECh. 3.2 - Prob. 60ECh. 3.2 - Prob. 61ECh. 3.2 - Prob. 62ECh. 3.2 - Prob. 63ECh. 3.3 - Following are final exam scores, arranged in...Ch. 3.3 - Prob. 2CYUCh. 3.3 - Prob. 3CYUCh. 3.3 - Prob. 4CYUCh. 3.3 - Prob. 5ECh. 3.3 - In Exercises 5–8, fill in each blank with the...Ch. 3.3 - Prob. 7ECh. 3.3 - In Exercises 5–8, fill in each blank with the...Ch. 3.3 - Prob. 9ECh. 3.3 - In Exercises 9–12, determine whether the statement...Ch. 3.3 - Prob. 11ECh. 3.3 - Prob. 12ECh. 3.3 - A population has mean μ = 7 and standard deviation...Ch. 3.3 - Prob. 14ECh. 3.3 - Prob. 15ECh. 3.3 - Prob. 16ECh. 3.3 - Prob. 17ECh. 3.3 - Prob. 18ECh. 3.3 - Prob. 19ECh. 3.3 - For the data set a. Find the 80th percentile. b....Ch. 3.3 - Standardized tests: In a recent year, the mean...Ch. 3.3 - A fish story: The mean length of one-year-old...Ch. 3.3 - Prob. 23ECh. 3.3 - Blood pressure in women: The article referred to...Ch. 3.3 - Hazardous waste: Following is a list of the number...Ch. 3.3 - Cholesterol levels: The National Health and...Ch. 3.3 - Commuting to work: Jamie drives to work every...Ch. 3.3 - Windy city by the bay: Following are wind speeds...Ch. 3.3 - Caffeine: Following are the number of grams of...Ch. 3.3 - Nuclear power: The following table presents the...Ch. 3.3 - Place your bets: Recently, 28 states in the U.S....Ch. 3.3 - Hail to the chief: There have been 57 presidential...Ch. 3.3 - Prob. 33ECh. 3.3 - Prob. 34ECh. 3.3 - Prob. 35ECh. 3.3 - Automotive emissions: Following are levels of...Ch. 3.3 - Prob. 37ECh. 3.3 - Prob. 38ECh. 3.3 - Prob. 39ECh. 3.3 - Boxplot possible? Following is the five-number...Ch. 3.3 - Unusual boxplot: Ten residents of a town were...Ch. 3.3 - Prob. 42ECh. 3.3 - The vanishing outlier: Seven families live on a...Ch. 3.3 - Prob. 44ECh. 3.3 - Prob. 45ECh. 3 - Of the mean, median, and mode, which must be a...Ch. 3 - Prob. 2CQCh. 3 - Prob. 3CQCh. 3 - Prob. 4CQCh. 3 - Prob. 5CQCh. 3 - Prob. 6CQCh. 3 - Each of the following histograms represents a data...Ch. 3 - Prob. 8CQCh. 3 - Prob. 9CQCh. 3 - Prob. 10CQCh. 3 - Prob. 11CQCh. 3 - Prob. 12CQCh. 3 - Prob. 13CQCh. 3 - Prob. 14CQCh. 3 - Prob. 15CQCh. 3 - Prob. 1RECh. 3 - Prob. 2RECh. 3 - Prob. 3RECh. 3 - Prob. 4RECh. 3 - Prob. 5RECh. 3 - Prob. 6RECh. 3 - Measure that ball: Each of 16 students measured...Ch. 3 - Prob. 8RECh. 3 - Prob. 9RECh. 3 - How long can you talk? A manufacturer of cell...Ch. 3 - Prob. 11RECh. 3 - Advertising costs: The amounts spent (in billions)...Ch. 3 - Prob. 13RECh. 3 - Prob. 14RECh. 3 - Prob. 15RECh. 3 - Prob. 1WAICh. 3 - Explain why the Empirical Rule is more useful than...Ch. 3 - Prob. 3WAICh. 3 - Prob. 4WAICh. 3 - Prob. 5WAICh. 3 - Prob. 1CSCh. 3 - Prob. 2CSCh. 3 - Prob. 3CSCh. 3 - Prob. 4CSCh. 3 - Prob. 5CSCh. 3 - Prob. 6CSCh. 3 - Prob. 7CSCh. 3 - Prob. 8CSCh. 3 - Prob. 9CS
Knowledge Booster
Background pattern image
Statistics
Learn more about
Need a deep-dive on the concept behind this application? Look no further. Learn more about this topic, statistics and related others by exploring similar questions and additional content below.
Recommended textbooks for you
Text book image
Glencoe Algebra 1, Student Edition, 9780079039897...
Algebra
ISBN:9780079039897
Author:Carter
Publisher:McGraw Hill
What Are Research Ethics?; Author: HighSchoolScience101;https://www.youtube.com/watch?v=nX4c3V23DZI;License: Standard YouTube License, CC-BY
What is Ethics in Research - ethics in research (research ethics); Author: Chee-Onn Leong;https://www.youtube.com/watch?v=W8Vk0sXtMGU;License: Standard YouTube License, CC-BY