Statistics for Business & Economics, Revised (MindTap Course List)
12th Edition
ISBN: 9781285846323
Author: David R. Anderson, Dennis J. Sweeney, Thomas A. Williams, Jeffrey D. Camm, James J. Cochran
Publisher: South-Western College Pub
bartleby

Concept explainers

bartleby

Videos

Textbook Question
Book Icon
Chapter 3, Problem 1CP

Pelican Stores

Pelican Stores, a division of National Clothing, is a chain of women’s apparel stores operating throughout the country. The chain recently ran a promotion in which discount coupons were sent to customers of other National Clothing stores. Data collected for a sample of 100 instore credit card transactions at Pelican Stores during one day while the promotion was running are contained in the file named PelicanStores. Table 3.9 shows a portion of the data set. The proprietary card method of payment refers to charges made using a National Clothing charge card. Customers who made a purchase using a discount coupon are referred to as promotional customers and customers who made a purchase but did not use a discount coupon are referred to as regular customers. Because the promotional coupons were not sent to regular Pelican Stores customers, management considers the sales made to people presenting the promotional coupons as sales it would not otherwise make. Of course, Pelican also hopes that the promotional customers will continue to shop at its stores.

TABLE 3.9 SAMPLE OF 100 CREDIT CARD PURCHASES AT PELICAN STORES

Chapter 3, Problem 1CP, Pelican Stores Pelican Stores, a division of National Clothing, is a chain of womens apparel stores

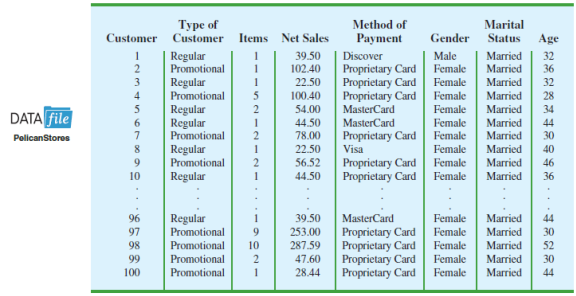
Most of the variables shown in Table 3.9 are self-explanatory, but two of the variables require some clarification.

Items The total number of items purchased
Net Sales The total amount ($) charged to the credit card

Pelican’s management would like to use this sample data to learn about its customer base and to evaluate the promotion involving discount coupons.

Managerial Report

Use the methods of descriptive statistics presented in this chapter to summarize the data and comment on your findings. At a minimum, your report should include the following:

  1. 1. Descriptive statistics on net sales and descriptive statistics on net sales by various classifications of customers.
  2. 2. Descriptive statistics concerning the relationship between age and net sales.
Blurred answer

Chapter 3 Solutions

Statistics for Business & Economics, Revised (MindTap Course List)

Ch. 3.1 - According to the National Education Association...Ch. 3.1 - The Big Bang Theory, a situation comedy featuring...Ch. 3.1 - In automobile mileage and gasoline-consumption...Ch. 3.1 - The data contained in the file named StateUnemp...Ch. 3.1 - Martinez Auto Supplies has retail stores located...Ch. 3.1 - The grade point average for college students is...Ch. 3.1 - The following table shows the total return and the...Ch. 3.1 - Based on a survey of masters programs in business...Ch. 3.1 - Annual revenue for Corning Supplies grew by 5.5%...Ch. 3.1 - Suppose that at the beginning of 2004 you invested...Ch. 3.1 - If an asset declines in value from 5000 to 3500...Ch. 3.1 - The current value of a company is 25 million. If...Ch. 3.2 - Consider a sample with data values of 10, 20, 12,...Ch. 3.2 - Consider a sample with data values of 10, 20, 12,...Ch. 3.2 - Consider a sample with data values of 27, 25, 20,...Ch. 3.2 - A bowlers scores for six games were 182, 168, 184,...Ch. 3.2 - The results of a search to find the least...Ch. 3.2 - The Australian Open is the first of the four grand...Ch. 3.2 - The Los Angeles times regularly reports the air...Ch. 3.2 - The following data were used to construct the...Ch. 3.2 - The results of Accounting Principals latest...Ch. 3.2 - Prob. 32ECh. 3.2 - Scores turned in by an amateur golfer at the...Ch. 3.2 - The following times were recorded by the...Ch. 3.3 - Consider a sample with data values of 10, 20, 12,...Ch. 3.3 - Consider a sample with a mean of 500 and a...Ch. 3.3 - Consider a sample with a mean of 30 and a standard...Ch. 3.3 - Suppose the data have a bell-shaped distribution...Ch. 3.3 - The results of a national survey showed that on...Ch. 3.3 - The energy information Administration reported...Ch. 3.3 - The national average for the math portion of the...Ch. 3.3 - Many families in California are using backyard...Ch. 3.3 - Florida Power Light (FPL) Company has enjoyed a...Ch. 3.3 - A sample of 10 NCAA college basketball game scores...Ch. 3.3 - The Associated Press Team Marketing Report listed...Ch. 3.4 - Consider a sample with data values of 27, 25, 20,...Ch. 3.4 - Prob. 47ECh. 3.4 - Prob. 48ECh. 3.4 - A data set has a first quartile of 42 and a third...Ch. 3.4 - Naples, Florida, hosts a half-marathon (13.1-mile...Ch. 3.4 - Annual sales, in millions of dollars, for 21...Ch. 3.4 - Consumer Reports provided overall customer...Ch. 3.4 - The Philadelphia Phillies defeated the Tampa Bay...Ch. 3.4 - A listing of 46 mutual funds and their 12-month...Ch. 3.5 - Five observations taken for two variables follow....Ch. 3.5 - Five observations taken for two variables follow....Ch. 3.5 - Ten major college football bowl games were played...Ch. 3.5 - A department of transportations study on driving...Ch. 3.5 - At the beginning of 2009, the economic downturn...Ch. 3.5 - The Dow Jones Industrial Average (DJIA) and the...Ch. 3.5 - Prob. 61ECh. 3 - The average number of times Americans dine out in...Ch. 3 - The U.S. Census Bureau provides statistics on...Ch. 3 - The average waiting time for a patient at an El...Ch. 3 - The U.S. Department of Education reports that...Ch. 3 - Small business owners often look to payroll...Ch. 3 - Public transportation and the automobile are two...Ch. 3 - The National Association of Realtors reported the...Ch. 3 - Prob. 69SECh. 3 - Travel + Leisure magazine provides an annual list...Ch. 3 - Morningstar tracks the performance of a large...Ch. 3 - Does a major league baseball teams record during...Ch. 3 - The days to maturity for a sample of five money...Ch. 3 - Automobiles traveling on a road with a posted...Ch. 3 - The Panama Railroad Company was established in...Ch. 3 - Pelican Stores Pelican Stores, a division of...Ch. 3 - Motion Picture Industry The motion picture...Ch. 3 - Business Schools of Asia-Pacific The pursuit of a...Ch. 3 - Heavenly Chocolates Website Transactions Heavenly...Ch. 3 - African Elephant Populations Although millions of...
Knowledge Booster
Background pattern image
Statistics
Learn more about
Need a deep-dive on the concept behind this application? Look no further. Learn more about this topic, statistics and related others by exploring similar questions and additional content below.
Recommended textbooks for you
Text book image
Functions and Change: A Modeling Approach to Coll...
Algebra
ISBN:9781337111348
Author:Bruce Crauder, Benny Evans, Alan Noell
Publisher:Cengage Learning
Text book image
Glencoe Algebra 1, Student Edition, 9780079039897...
Algebra
ISBN:9780079039897
Author:Carter
Publisher:McGraw Hill
The Shape of Data: Distributions: Crash Course Statistics #7; Author: CrashCourse;https://www.youtube.com/watch?v=bPFNxD3Yg6U;License: Standard YouTube License, CC-BY
Shape, Center, and Spread - Module 20.2 (Part 1); Author: Mrmathblog;https://www.youtube.com/watch?v=COaid7O_Gag;License: Standard YouTube License, CC-BY
Shape, Center and Spread; Author: Emily Murdock;https://www.youtube.com/watch?v=_YyW0DSCzpM;License: Standard Youtube License