Statistical Reasoning for Everyday Life, Books a la Carte Edition, Plus NEW MyLab Statistics with Pearson eText -- Access Card Package (5th Edition)
5th Edition
ISBN: 9780134668390
Author: Jeffrey O. Bennett, William L. Briggs, Mario F. Triola
Publisher: PEARSON
bartleby

Concept explainers

bartleby

Videos

Textbook Question
Book Icon
Chapter 3, Problem 1CRE

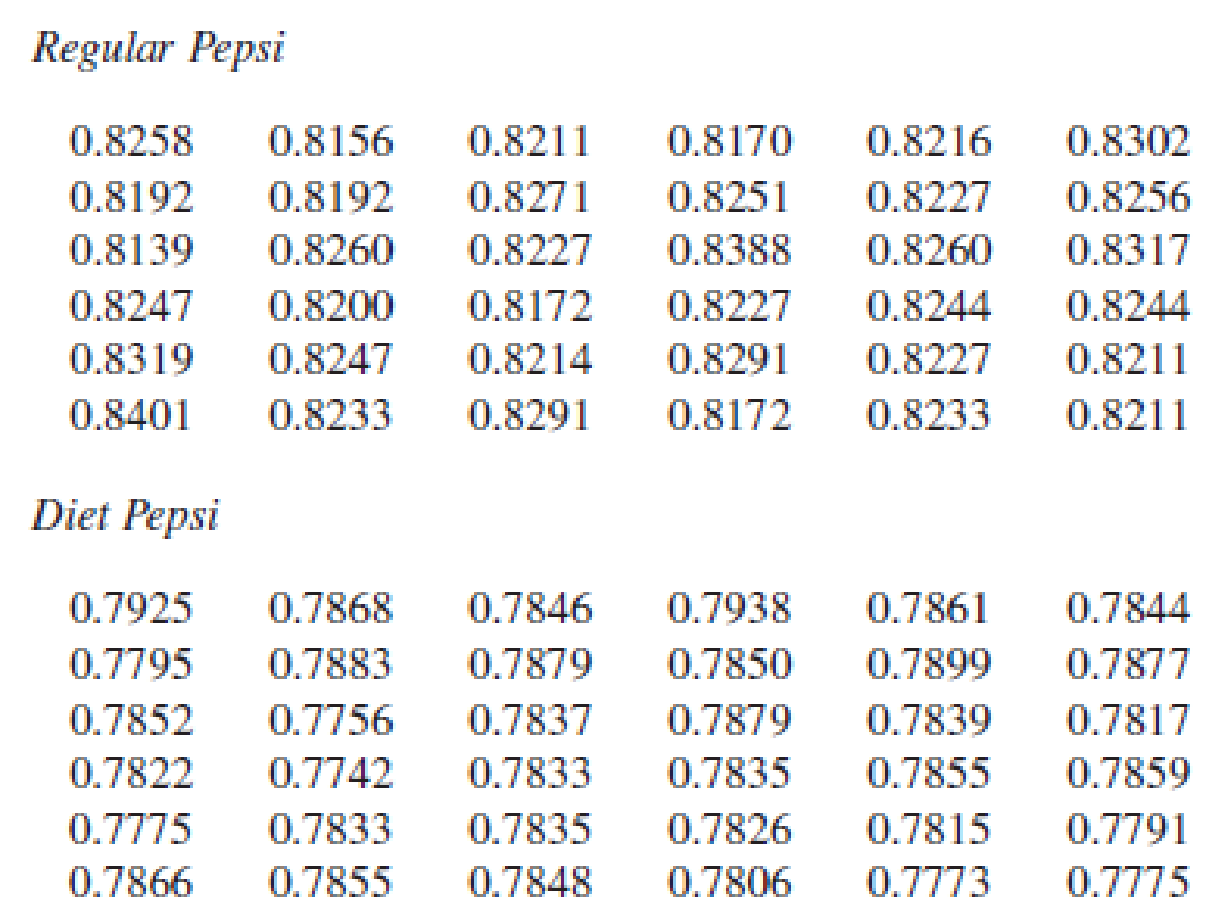
Listed below are measured weights (in pounds) of the contents in samples of cans of regular Pepsi and Diet Pepsi. Use these data for Exercises 1–3

Chapter 3, Problem 1CRE, Listed below are measured weights (in pounds) of the contents in samples of cans of regular Pepsi

1.

  1. a. Construct a frequency table for the weights of regular Pepsi. Use these bins:

    0.8130–0.8179

    0.8180–0.8229

    0.8230–0.8279

    0.8280–0.8329

    0.8330–0.8379

    0.8380–0.8429

  2. b. Construct a frequency table for the weights of Diet Pepsi. Use these bins:

    0.7740–0.7779

    0.7780–0.7819

    0.7820–0.7859

    0.7860–0.7899

    0.7900–0.7939

  3. c. Compare the frequency tables from parts (a) and (b). What notable differences are there? How can those notable differences be explained?

a.

Expert Solution
Check Mark
To determine

Create a frequency table for the weights of regular Pepsi using the given bins.

Answer to Problem 1CRE

The relative frequency table for the weights of regular Pepsi using the given bins is as follows,

WeightsFrequency
0.8130–0.81795
0.8180–0.822912
0.8230–0.827912
0.8280–0.83295
0.8330–0.83790
0.8380-0.84292
Total36

Explanation of Solution

Calculation

The given information is that,the data represents the weights (in pounds) of the contents in samples of cans of Regular Pepsi and Diet Pepsi.

From the data it is observed that, the values are ranging from 0.8139 to 0.8401. One-way to arrange the data in a group with these bins are classify the weights into different groups. Those are, 0.8130-0.8179, 0.8180-0.8229, 0.8230-0.8279, 0.8280-0.8329, 0.8330-0.8379 and 0.8380-0.8429.

Now, count the frequency for each bin. That is, 5 for bin 0.8130-0.8176 because in that range there are 5 cans and for bin 0.8180-0.8229, 12. Similarly the remaining frequencies are obtained and tabulated below.

The frequency table is as follows,

WeightsFrequency
0.8130–0.81795
0.8180–0.822912
0.8230–0.827912
0.8280–0.83295
0.8330–0.83790
0.8380–0.84292
Total36

b.

Expert Solution
Check Mark
To determine

Create a frequency table for the weights of Diet Pepsi.

Answer to Problem 1CRE

The frequency table for the weights of Diet Pepsi is as follows,

WeightsFrequency
0.7740–0.77795
0.7780–0.78195
0.7820–0.785916
0.7860–0.78998
0.7900–0.79392
Total36

Explanation of Solution

Calculation

From the data it is observed that, the values are ranging from 0.7742 to 0.7938. The groups for the weights of different bins are 0.7740-0.7779, 0.7780-0.7819, 0.7820-0.7859, 0.7860-0.7899 and 0.7900-0.7939.

Now, count the frequency for each bin. That is, 5 for bin 0.7740-0.7779 because in that range there are 5 cans and for bin 0.7780-0.7819, 5. Similarly the frequencies for remaining bins are obtained and tabulated below.

The frequency table is as follows,

WeightsFrequency
0.7740–0.77795
0.7780–0.78195
0.7820–0.785916
0.7860–0.78998
0.7900–0.79392
Total36

c.

Expert Solution
Check Mark
To determine

Explain whether there are any notable differences by comparing the frequency tables from parts (a) and (b).

Explanation of Solution

From the frequencies tables of parts (a) and (b) it can be observed that, the regular Pepsi weights are more than the diet Pepsi weights because of the sugar levels in the regular Pepsi. But the volumes of both type cans are approximately same.

Want to see more full solutions like this?

Subscribe now to access step-by-step solutions to millions of textbook problems written by subject matter experts!

Chapter 3 Solutions

Statistical Reasoning for Everyday Life, Books a la Carte Edition, Plus NEW MyLab Statistics with Pearson eText -- Access Card Package (5th Edition)

Ch. 3.1 - Pulse Rates of Females. In Exercises 912, refer to...Ch. 3.1 - Pulse Rates of Females. In Exercises 912, refer to...Ch. 3.1 - Birth Days. Births at a hospital in New York State...Ch. 3.1 - Clinical Trial. As part of a clinical trial, the...Ch. 3.1 - Train Derailments. An analysis of 50 train...Ch. 3.1 - Analysis of Last Digits. Weights of respondents...Ch. 3.1 - Academy Award-Winning Male Actors. The following...Ch. 3.1 - Body Temperatures. The following data show the...Ch. 3.1 - Loaded Die. An experiment was conducted in which a...Ch. 3.1 - Interpreting Family Data. Consider the following...Ch. 3.1 - Computer Keyboards. The traditional keyboard...Ch. 3.1 - Double Binning. The students in a statistics class...Ch. 3.2 - Distribution Graph. What is a distribution of...Ch. 3.2 - Qualitative Data. Which types of graph described...Ch. 3.2 - Yearly Data. Which type of graph described in this...Ch. 3.2 - Histogram and Stemplot. Assume that a data set is...Ch. 3.2 - Prob. 5ECh. 3.2 - Does It Make Sense? For Exercises 58, determine...Ch. 3.2 - Does It Make Sense? For Exercises 58, determine...Ch. 3.2 - Does It Make Sense? For Exercises 58, determine...Ch. 3.2 - Histogram. Children living near a smelter in Texas...Ch. 3.2 - Understanding Data. Suppose you have a list of...Ch. 3.2 - Most Appropriate Display. Exercises 1114 describe...Ch. 3.2 - Most Appropriate Display. Exercises 1114 describe...Ch. 3.2 - Most Appropriate Display. Exercises 1114 describe...Ch. 3.2 - Most Appropriate Display. Exercises 1114 describe...Ch. 3.2 - Academy Award-Winning Male Actors. Exercise 17 in...Ch. 3.2 - Body Temperatures. Exercise 18 in Section 3.1...Ch. 3.2 - Job Hunting. A survey was conducted to determine...Ch. 3.2 - Job Hunting. Refer to the data given in Exercise...Ch. 3.2 - Prob. 19ECh. 3.2 - Job Application Mistakes Construct a Pareto chart...Ch. 3.2 - Dotplot. Refer to the QWERTY data in Exercise 21...Ch. 3.2 - Dotplot. Refer to the Dvorak data in Exercise 21...Ch. 3.2 - Stemplot. Construct a stemplot of these test...Ch. 3.2 - Stemplot. Listed below are the lengths (in...Ch. 3.2 - DJIA. Listed below (in order by row) are annual...Ch. 3.2 - Home Runs. Listed below (in order by row) are the...Ch. 3.3 - Multiple Data. Briefly describe how each of the...Ch. 3.3 - Prob. 2ECh. 3.3 - Prob. 3ECh. 3.3 - Prob. 4ECh. 3.3 - Does It Make Sense? For Exercises 58, determine...Ch. 3.3 - Does It Make Sense? For Exercises 58, determine...Ch. 3.3 - Does It Make Sense? For Exercises 58, determine...Ch. 3.3 - Does It Make Sense? For Exercises 58, determine...Ch. 3.3 - Public and Private Colleges. The stack plot in...Ch. 3.3 - Home Prices by Region. The graph in Figure 3.21...Ch. 3.3 - Gender and Salary. Consider the display in Figure...Ch. 3.3 - Marriage and Divorce Rates. The graph in Figure...Ch. 3.3 - Prob. 13ECh. 3.3 - College Degrees. The stack plot in Figure 3.25...Ch. 3.3 - Contour Map. For Exercises 17 and 18, refer to the...Ch. 3.3 - Prob. 18ECh. 3.3 - Prob. 19ECh. 3.3 - Prob. 20ECh. 3.3 - Infographic. For Exercises 21 and 22, refer to...Ch. 3.3 - Infographic. For Exercises 21 and 22, refer to...Ch. 3.3 - Creating Graphics. Exercises 2326 give tables of...Ch. 3.3 - Creating Graphics. Exercises 2326 give tables of...Ch. 3.3 - Firearms Fatalities. The following table...Ch. 3.3 - Prob. 26ECh. 3.4 - Perceptual Distortion. Use a ruler to measure the...Ch. 3.4 - Prob. 2ECh. 3.4 - Prob. 3ECh. 3.4 - Prob. 4ECh. 3.4 - Does It Make Sense? For Exercises 58, determine...Ch. 3.4 - Does It Make Sense? For Exercises 58, determine...Ch. 3.4 - Does It Make Sense? For Exercises 58, determine...Ch. 3.4 - Does It Make Sense? For Exercises 58, determine...Ch. 3.4 - Exaggerating a Difference. Weekly instruction time...Ch. 3.4 - Graph of Sounds. In a survey conducted by Kelton...Ch. 3.4 - Graph Dimensions. A newspaper used images of...Ch. 3.4 - Prob. 12ECh. 3.4 - Prob. 13ECh. 3.4 - DJIA. Figure 3.36 on the next page depicts the...Ch. 3.4 - Prob. 15ECh. 3.4 - Prob. 16ECh. 3.4 - Prob. 17ECh. 3.4 - Moores Law. In 1965, Intel cofounder Gordon Moore...Ch. 3.4 - Prob. 19ECh. 3.4 - Prob. 20ECh. 3.4 - Constant Dollars. The graph in Figure 3.41 shows...Ch. 3.4 - Prob. 22ECh. 3 - Listed below are measured weights (in pounds) of...Ch. 3 - Listed below are measured weights (in pounds) of...Ch. 3 - Listed below are measured weights (in pounds) of...Ch. 3 - Pie Chart for Sports Equipment. USA Today reported...Ch. 3 - Pareto Chart for Sports Equipment. Construct a...Ch. 3 - Bar Chart. Figure 3.43 shows the numbers of U.S....Ch. 3 - As a quality control manager at Ford Motor...Ch. 3 - As a quality control manager at Ford, you monitor...Ch. 3 - A stemplot is created with the braking distances...Ch. 3 - A dotplot of braking distances (in feet) of cars...Ch. 3 - The first category in a frequency table is 90100,...Ch. 3 - The first category in a relative frequency table...Ch. 3 - The third category in a frequency table has a...Ch. 3 - Prob. 8CQCh. 3 - When constructing a graph of the same categorical...Ch. 3 - Body Temperatures Listed below are body...Ch. 3 - Why are pictographs generally poor for depicting...Ch. 3 - Note that this graph plots six variables: two...Ch. 3 - Prob. 2.2FCh. 3 - Prob. 2.3F

Additional Math Textbook Solutions

Find more solutions based on key concepts
Knowledge Booster
Background pattern image
Statistics
Learn more about
Need a deep-dive on the concept behind this application? Look no further. Learn more about this topic, statistics and related others by exploring similar questions and additional content below.
Recommended textbooks for you
Text book image
Glencoe Algebra 1, Student Edition, 9780079039897...
Algebra
ISBN:9780079039897
Author:Carter
Publisher:McGraw Hill
Text book image
Holt Mcdougal Larson Pre-algebra: Student Edition...
Algebra
ISBN:9780547587776
Author:HOLT MCDOUGAL
Publisher:HOLT MCDOUGAL
The Shape of Data: Distributions: Crash Course Statistics #7; Author: CrashCourse;https://www.youtube.com/watch?v=bPFNxD3Yg6U;License: Standard YouTube License, CC-BY
Shape, Center, and Spread - Module 20.2 (Part 1); Author: Mrmathblog;https://www.youtube.com/watch?v=COaid7O_Gag;License: Standard YouTube License, CC-BY
Shape, Center and Spread; Author: Emily Murdock;https://www.youtube.com/watch?v=_YyW0DSCzpM;License: Standard Youtube License