Microeconomic Theory
12th Edition
ISBN: 9781337517942
Author: NICHOLSON
Publisher: Cengage
bartleby

Concept explainers

Question
100%
Book Icon
Chapter 3, Problem 3.1P

a

To determine

To prove:

Graphical representation of utility function whether IC curve is convex or not.

a

Expert Solution
Check Mark

Explanation of Solution

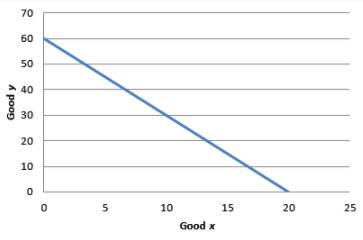
The utility function is linear. This means that the goods x and y are perfect substitutes. For simplicity, the value of utility is taken to be constant at 60. Then the equation for the indifference curve becomes:

  60=3x+y

To graph the indifference curve:

Microeconomic Theory, Chapter 3, Problem 3.1P , additional homework tip  1

Graph 1

  MRS=dydx=UxUy

  y=603xdydx=3

The MRS is constant at 3. Hence, the IC curve is not convex.

Economics Concept Introduction

Introduction:

Rate of substitution is the ratio of two goods at which consumer gives away a quantity of good 1 in order to get good 2

b)

To determine

To prove:

Graphical representation of utility function whether IC curve is convex or not.

b)

Expert Solution
Check Mark

Explanation of Solution

Let utility function be set equal to 10.

Then the equation will be:

  10=xy

  100=xy

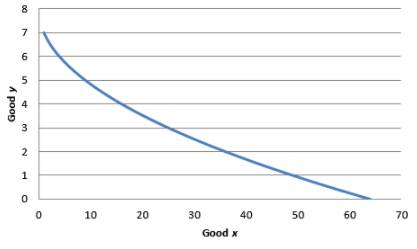
The IC for utility equal to 10 can be obtained by graphing the following equation:
  y=100x

Microeconomic Theory, Chapter 3, Problem 3.1P , additional homework tip  2

Graph 2

  MRS=dydx=12x

For equation, y=100x

  dydx=100x2

As x is in the denominator, the MRS decreases when x increases. Hence indifference curve is convex.

Economics Concept Introduction

Introduction:

Rate of substitution is the ratio of two goods at which consumer gives away a quantity of good 1 in order to get good 2

c)

To determine

To prove:

Graphical representation of utility function whether IC curve is convex or not.

c)

Expert Solution
Check Mark

Explanation of Solution

To simplify the function, arbitrarily set the utility at 8. So, the utility function becomes

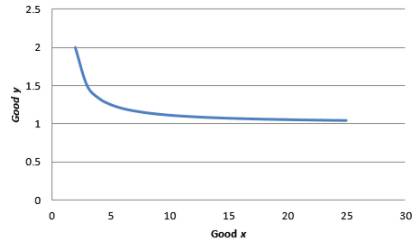
  8=x+y

Graphical representation:

Microeconomic Theory, Chapter 3, Problem 3.1P , additional homework tip  3

Graph 3

  MRS=dydx=UxUy

  dydx=12x

As x is in the denominator, the MRS decreases when x increases. Hence indifference curve is convex.

Economics Concept Introduction

Introduction:

Rate of substitution is the ratio of two goods at which consumer gives away a quantity of good 1 in order to get good 2

d)

To determine

To prove:

Graphical representation of utility function whether IC curve is convex or not.

d)

Expert Solution
Check Mark

Explanation of Solution

Utility is set equal to 4. Then the equation for equation is:

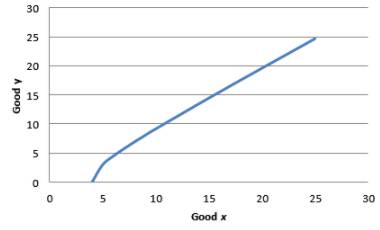
  4=x2y2

  16=x2y2

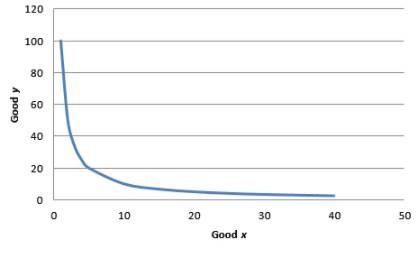
The indifference curve for utility equal to 4:

The graph is shown below:
Microeconomic Theory, Chapter 3, Problem 3.1P , additional homework tip  4

Graph 4

  MRS=dydx=xy

In the above equation, x is numerator. Though there is a negative sign in front of the fraction. This means that as x increases, the marginal rate of substitution increases.

Hence, the indifference curves are not convex.

Economics Concept Introduction

Introduction:

Rate of substitution is the ratio of two goods at which consumer gives away a quantity of good 1 in order to get good 2

e)

To determine

To prove:

Graphical representation of utility function whether IC curve is convex or not.

e)

Expert Solution
Check Mark

Explanation of Solution

To simplify the problem, we arbitrarily take utility equal to 1.

  1=xyx+y

To graph the indifference curve,

  Ux=2xUy=2yy=xx1

Microeconomic Theory, Chapter 3, Problem 3.1P , additional homework tip  5

Graph 5

MRS = dydz=((x1)×1)(x1)(x1)2

In the above equation, x is in numerator. Hence, as x increases the marginal rate of substitution decreases. Hence, the indifference curves are convex.

Economics Concept Introduction

Introduction:

Rate of substitution is the ratio of two goods at which consumer gives away a quantity of good 1 in order to get good 2

Want to see more full solutions like this?

Subscribe now to access step-by-step solutions to millions of textbook problems written by subject matter experts!
Students have asked these similar questions
An indifference curve is the locus of points of combination of goods which gives equal satisfaction to the consumer and consumer became indifferent about those combination of good. What is the relevance of equilibrium conditions to identify consumers equilibrium under indifference curve analysis, how it is different from cardinal measurement of utility?
Economists use "indifference curves" to indicate individuals' preferences. These curves are parallel to each other and do not intersect. Which of the following statements is true? A) The further away an indifference curve is from the origin at (0,0), the lower is the individual's happiness.  B) On a downward-sloping indifference curve, the points lower down (towards the right-hand-side) on the curve are preferred by the individual.  C) The closer an indifference curve is to the origin at (0,0), the higher is the individual's happiness.  D) The further away an indifference curve is from the origin at (0,0), the higher is the individual's happiness.
The "useful" are hypothetical units of measurement with which we suppose it can be measure the “satisfaction” that a consumer can derive from consuming a good or service. The amount of utility (satisfaction) that the consumer can derive from consuming a good or service remains constant, no matter how much we consume. "Utility" is something we can measure objectively and is the same for all beings humans. Likewise, we can know in advance the usefulness of a good before consume it. An “indifference” curve represents the combination of two goods that we would want consume, regardless of disposable income or their price.  A consumer is in "equilibrium" when his indifference curve is tangent (touches) his budget line. Truth or false and why
Knowledge Booster
Background pattern image
Economics
Learn more about
Need a deep-dive on the concept behind this application? Look no further. Learn more about this topic, economics and related others by exploring similar questions and additional content below.
Recommended textbooks for you
Text book image
Microeconomic Theory
Economics
ISBN:9781337517942
Author:NICHOLSON
Publisher:Cengage
Text book image
Economics For Today
Economics
ISBN:9781337613040
Author:Tucker
Publisher:Cengage Learning
Text book image
Micro Economics For Today
Economics
ISBN:9781337613064
Author:Tucker, Irvin B.
Publisher:Cengage,
Text book image
Microeconomics: Principles & Policy
Economics
ISBN:9781337794992
Author:William J. Baumol, Alan S. Blinder, John L. Solow
Publisher:Cengage Learning
Text book image
Economics (MindTap Course List)
Economics
ISBN:9781337617383
Author:Roger A. Arnold
Publisher:Cengage Learning
Text book image
Microeconomics
Economics
ISBN:9781337617406
Author:Roger A. Arnold
Publisher:Cengage Learning