
Concept explainers
Videos
a.
Draw a
a.
Answer to Problem 3.21SE
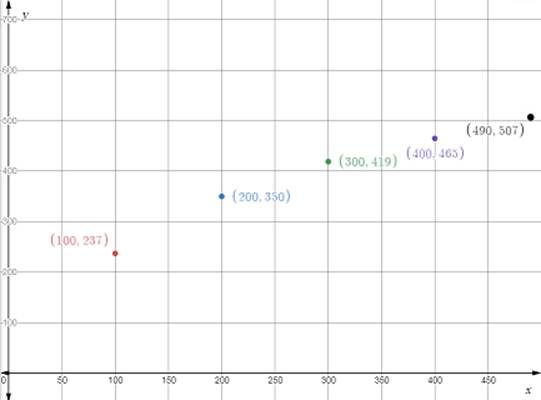
The scatterplot is.
Explanation of Solution
Given:
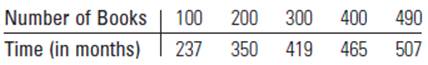
The table shows the data are the times (in months)required to write his books, in increments of
Calculation:
The scatterplot for the given points are.

The horizontal axis x represents the number of books and the vertical axis y represents the time (in months).
b.
Is the relationship between the two variables are linear?
b.
Answer to Problem 3.21SE
The relationship is not linear.
Explanation of Solution
Given:
The table shows the data are the times (in months) required to write his books, in increments of

Calculation:
The scatterplot for the given points are.

The horizontal axis x represents the number of books and the vertical axis y represents the time (in months).
In the scatterplot,
The pattern position is upward
Strength
Formed
Hence the relationship is not linear.
Want to see more full solutions like this?
Chapter 3 Solutions
Introduction to Probability and Statistics


- Speed Skating Two speed skaters, A and B, are racing in a 500-m event. The graph shows the distance they have traveled as a function of the time from the start of the race. aWho won the race? bFind the average speed during the first 10 s for each skater. cFind the average speed during the last 15 s for each skater.arrow_forward6. Tuition at American Private Universities The following table shows the average yearly tuition and required fees, in dollars, charged by four-year American private nonprofit universities in the school year ending in the given year. Date Average tuition 2012 27,870 2013 29,004 2014 30,138 2015 31,272 2016 32,406 a. Show that these data can be modeled by a linear function, and find its formula. b. Plot the data points and add the graph of the linear formula you found in part a. c. What prediction does this formula give for average tuition and fees at four-year American private nonprofit universities for the academic year ending in 2021?arrow_forward
 Algebra & Trigonometry with Analytic GeometryAlgebraISBN:9781133382119Author:SwokowskiPublisher:Cengage
 Functions and Change: A Modeling Approach to Coll...AlgebraISBN:9781337111348Author:Bruce Crauder, Benny Evans, Alan NoellPublisher:Cengage Learning
 College AlgebraAlgebraISBN:9781305115545Author:James Stewart, Lothar Redlin, Saleem WatsonPublisher:Cengage Learning
 Algebra and Trigonometry (MindTap Course List)AlgebraISBN:9781305071742Author:James Stewart, Lothar Redlin, Saleem WatsonPublisher:Cengage Learning
 Big Ideas Math A Bridge To Success Algebra 1: Stu...AlgebraISBN:9781680331141Author:HOUGHTON MIFFLIN HARCOURTPublisher:Houghton Mifflin Harcourt