
Videos
Randy Harris, controller, has been given the charge to implement an advanced cost management system. As part of this process, he needs to identify activity drivers for the activities of the firm. During the past four months, Randy has spent considerable effort identifying activities, their associated costs, and possible drivers for the activities’ costs.
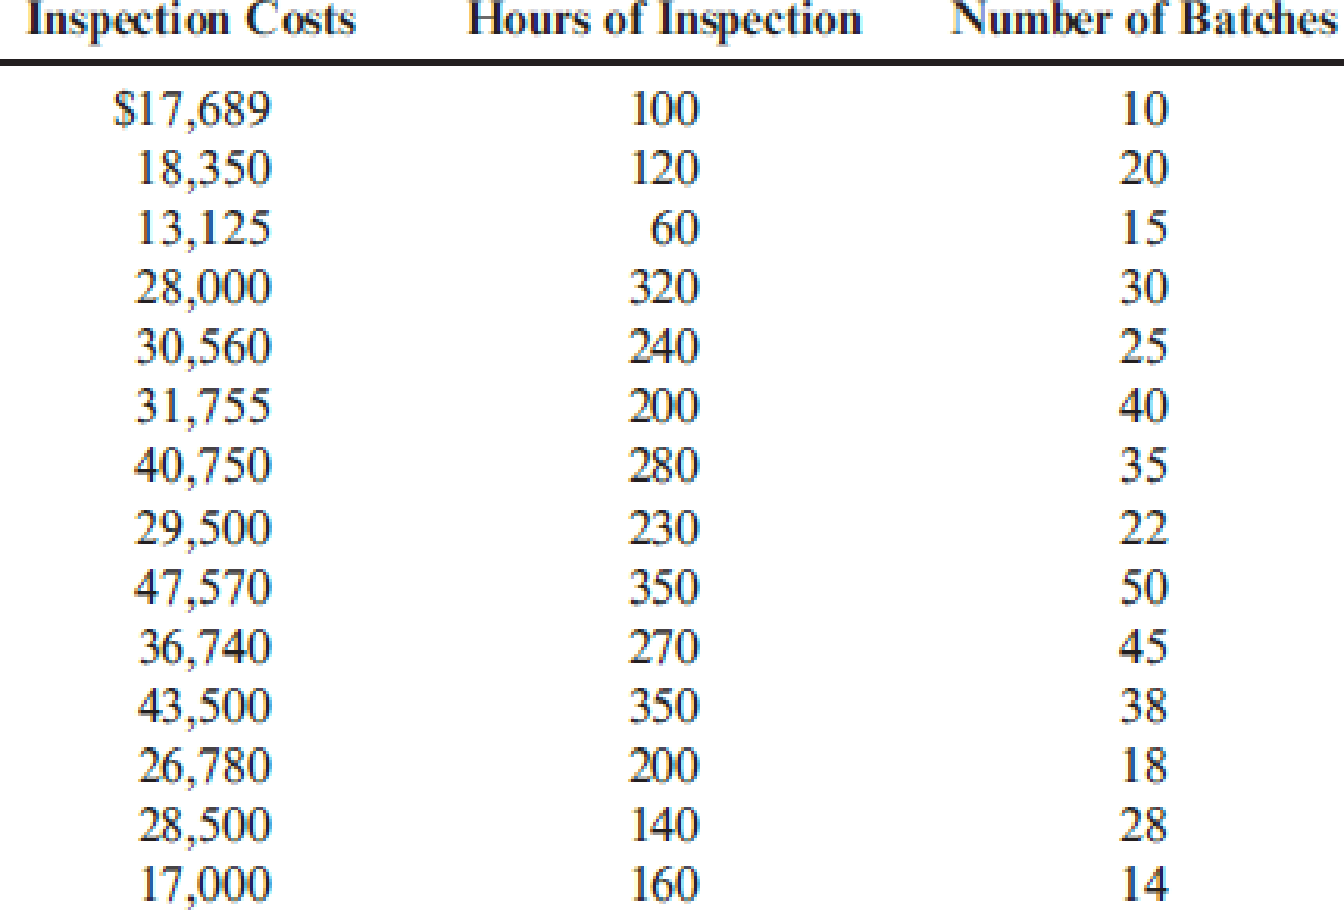
Initially, Randy made his selections based on his own judgment using his experience and input from employees who perform the activities. Later, he used regression analysis to confirm his judgment. Randy prefers to use one driver per activity, provided that an R2 of at least 80 percent can be produced. Otherwise, multiple drivers will be used, based on evidence provided by multiple regression analysis. For example, the activity of inspecting finished goods produced an R2 of less than 80 percent for any single activity driver. Randy believes, however, that a satisfactory cost formula can be developed using two activity drivers: the number of batches and the number of inspection hours. Data collected for a 14-month period are as follows:
Required:
- 1. Calculate the cost formula for inspection costs using the two drivers, inspection hours and number of batches. Are both activity drivers useful? What does the R2 indicate about the formula?
- 2. Using the formula developed in Requirement 1, calculate the inspection cost when 300 inspection hours are used and 30 batches are produced. Prepare a 90 percent confidence interval for this prediction.

Trending nowThis is a popular solution!

Chapter 3 Solutions
Cornerstones of Cost Management (Cornerstones Series)


- Joseph Fox, controller of Thorpe Company, has been in charge of a project to install an activity-based cost management system. This new system is designed to support the companys efforts to become more competitive. For the past six weeks, he and the project committee members have been identifying and defining activities, associating workers with activities, and assessing the time and resources consumed by individual activities. Now, he and the project committee are focusing on three additional implementation issues: (1) identifying activity drivers, (2) assessing value content, and (3) identifying cost drivers (root causes). Joseph has assigned a committee member the responsibilities of assessing the value content of five activities, choosing a suitable activity driver for each activity, and identifying the possible root causes of the activities. Following are the five activities with possible activity drivers: The committee member ran a regression analysis for each potential activity driver, using the method of least squares to estimate the variable and fixed cost components. In all five cases, costs were highly correlated with the potential drivers. Thus, all drivers appeared to be good candidates for assigning costs to products. The company plans to reward production managers for reducing product costs. Required: 1. What is the difference between an activity driver and a cost driver? In answering the question, describe the purpose of each type of driver. 2. For each activity, assess the value content and classify each activity as value-added or non-value-added (justify the classification). Identify some possible root causes of each activity, and describe how this knowledge can be used to improve activity performance. For purposes of discussion, assume that the value-added activities are not performed with perfect efficiency. 3. Describe the behavior that each activity driver will encourage, and evaluate the suitability of that behavior for the companys objective of becoming more competitive.arrow_forwardTom Young, vice president of Dunn Company (a producer of plastic products), has been supervising the implementation of an activity-based cost management system. One of Toms objectives is to improve process efficiency by improving the activities that define the processes. To illustrate the potential of the new system to the president, Tom has decided to focus on two processes: production and customer service. Within each process, one activity will be selected for improvement: molding for production and sustaining engineering for customer service. (Sustaining engineers are responsible for redesigning products based on customer needs and feedback.) Value-added standards are identified for each activity. For molding, the value-added standard calls for nine pounds per mold. (Although the products differ in shape and function, their size, as measured by weight, is uniform.) The value-added standard is based on the elimination of all waste due to defective molds (materials is by far the major cost for the molding activity). The standard price for molding is 15 per pound. For sustaining engineering, the standard is 60 percent of current practical activity capacity. This standard is based on the fact that about 40 percent of the complaints have to do with design features that could have been avoided or anticipated by the company. Current practical capacity (the first year) is defined by the following requirements: 18,000 engineering hours for each product group that has been on the market or in development for five years or less, and 7,200 hours per product group of more than five years. Four product groups have less than five years experience, and 10 product groups have more. There are 72 engineers, each paid a salary of 70,000. Each engineer can provide 2,000 hours of service per year. There are no other significant costs for the engineering activity. For the first year, actual pounds used for molding were 25 percent above the level called for by the value-added standard; engineering usage was 138,000 hours. There were 240,000 units of output produced. Tom and the operational managers have selected some improvement measures that promise to reduce non-value-added activity usage by 30 percent in the second year. Selected actual results achieved for the second year are as follows: The actual prices paid per pound and per engineering hour are identical to the standard or budgeted prices. Required: 1. For the first year, calculate the non-value-added usage and costs for molding and sustaining engineering. Also, calculate the cost of unused capacity for the engineering activity. 2. Using the targeted reduction, establish kaizen standards for molding and engineering (for the second year). 3. Using the kaizen standards prepared in Requirement 2, compute the second-year usage variances, expressed in both physical and financial measures, for molding and engineering. (For engineering, explain why it is necessary to compare actual resource usage with the kaizen standard.) Comment on the companys ability to achieve its targeted reductions. In particular, discuss what measures the company must take to capture any realized reductions in resource usage.arrow_forwardThe management of Wheeler Company has decided to develop cost formulas for its major overhead activities. Wheeler uses a highly automated manufacturing process, and power costs are a significant manufacturing cost. Cost analysts have decided that power costs are mixed; thus, they must be broken into their fixed and variable elements so that the cost behavior of the power usage activity can be properly described. Machine hours have been selected as the activity driver for power costs. The following data for the past eight quarters have been collected: Required: 1. Prepare a scattergraph by plotting power costs against machine hours. Does the scatter-graph show a linear relationship between machine hours and power cost? 2. Using the high and low points, compute a power cost formula. 3. Use the method of least squares to compute a power cost formula. Evaluate the coefficient of determination. 4. Rerun the regression and drop the point (20,000; 26,000) as an outlier. Compare the results from this regression to those for the regression in Requirement 3. Which is better?arrow_forward
- John Thomas, vice president of Mallett Company (a producer of a variety of plastic products), has been supervising the implementation of an ABC management system. John wants to improve process efficiency by improving the activities that define the processes. To illustrate the potential of the new system to the president, John has decided to focus on two processes: production and customer service. Within each process, one activity will be selected for improvement: materials usage for production and sustaining engineering for customer service (sustaining engineers are responsible for redesigning products based on customer needs and feedback). Value-added standards are identified for each activity. For materials usage, the value-added standard calls for six pounds per unit of output (the products differ in shape and function, but their weight is uniform). The value-added standard is based on the elimination of all waste due to defective molds. The standard price of materials is 5 per pound. For sustaining engineering, the standard is 58% of current practical activity capacity. This standard is based on the fact that about 42% of the complaints have to do with design features that could have been avoided or anticipated by the company. Current practical capacity (at the end of 20X1) is defined by the following requirements: 6,000 engineering hours for each product group that has been on the market or in development for 5 years or less and 2,400 hours per product group of more than 5 years. Four product groups have less than 5 years experience, and 10 product groups have more. Each of the 24 engineers is paid a salary of 60,000. Each engineer can provide 2,000 hours of service per year. No other significant costs are incurred for the engineering activity. Actual materials usage for 20X1 was 25% above the level called for by the value-added standard; engineering usage was 46,000 hours. A total of 80,000 units of output were produced. John and the operational managers have selected some improvement measures that promise to reduce nonvalue-added activity usage by 40% in 20X2. Selected actual results achieved for 20X2 are as follows: The actual prices paid for materials and engineering hours are identical to the standard or budgeted prices. Required: 1. For 20X1, calculate the nonvalue-added usage and costs for materials usage and sustaining engineering. 2. CONCEPTUAL CONNECTION Using the budgeted improvements, calculate the expected activity usage levels for 20X2. Now, compute the 20X2 usage variances (the difference between the expected and actual values), expressed in both physical and financial measures, for materials and engineering. Comment on the companys ability to achieve its targeted reductions. In particular, discuss what measures the company must take to capture any realized reductions in resource usage.arrow_forwardClassify the following cost drivers as structural, executional, or operational. a. Number of plants b. Number of moves c. Degree of employee involvement d. Capacity utilization e. Number of product lines f. Number of distribution channels g. Engineering hours h. Direct labor hours i. Scope j. Product configuration k. Quality management approach l. Number of receiving orders m. Number of defective units n. Employee experience o. Types of process technologies p. Number of purchase orders q. Type and efficiency of layout r. Scale s. Number of functional departments t. Number of planning meetingsarrow_forwardKagle design engineers are in the process of developing a new green product, one that will significantly reduce impact on the environment and yet still provide the desired customer functionality. Currently, two designs are being considered. The manager of Kagle has told the engineers that the cost for the new product cannot exceed 550 per unit (target cost). In the past, the Cost Accounting Department has given estimated costs using a unit-based system. At the request of the Engineering Department, Cost Accounting is providing both unit-and activity-based accounting information (made possible by a recent pilot study producing the activity-based data). Unit-based system: Variable conversion activity rate: 100 per direct labor hour Material usage rate: 20 per part ABC system: Labor usage: 15 per direct labor hour Material usage (direct materials): 20 per part Machining: 75 per machine hour Purchasing activity: 150 per purchase order Setup activity: 3,000 per setup hour Warranty activity: 500 per returned unit (usually requires extensive rework) Customer repair cost: 25 per repair hour (average) Required: 1. Select the lower-cost design using unit-based costing. Are logistical and post-purchase activities considered in this analysis? 2. Select the lower-cost design using ABC analysis. Explain why the analysis differs from the unit-based analysis. 3. What if the post-purchase cost was an environmental contaminant and amounted to 10 per unit for Design A and 40 per unit for Design B? Assume that the environmental cost is borne by society. Now which is the better design?arrow_forward
- Big Mikes, a large hardware store, has gathered data on its overhead activities and associated costs for the past 10 months. Nizam Sanjay, a member of the controllers department, believes that overhead activities and costs should be classified into groups that have the same driver. He has decided that unloading incoming goods, counting goods, and inspecting goods can be grouped together as a more general receiving activity, since these three activities are all driven by the number of receiving orders. The 10 months of data shown below have been gathered for the receiving activity. Required: 1. Prepare a scattergraph, plotting the receiving costs against the number of purchase orders. Use the vertical axis for costs and the horizontal axis for orders. 2. Select two points that make the best fit, and compute a cost formula for receiving costs. 3. Using the high-low method, prepare a cost formula for the receiving activity. 4. Using the method of least squares, prepare a cost formula for the receiving activity. What is the coefficient of determination?arrow_forwardAaron McKinney is a cost accountant for Majik Systems Inc. Martin Dodd, Vice President of Marketing, has asked Aaron to meet with representatives of Majik Systems major competitor to discuss product cost data. Martin indicates that the sharing of these data will enable Majik Systems to determine a fair and equitable price for its products. Would it be ethical for Aaron to attend the meeting and share the relevant cost data? Explain your answer.arrow_forwardAs manager of department B in MarIeys Manufacturing, based on the costs you identified in the previous exercise for further research, how does this impact the financial performance of your department, and what might be some questions you want to ask or solutions you might propose to Marleys management?arrow_forward
- Walsh & Coggins, a professional accounting firm, collects cost information about the services they provide to their clients. Describe the types of cost data they would collect and explain the importance of analyzing this cost data.arrow_forwardThe controller of the South Charleston plant of Ravinia, Inc., monitored activities associated with materials handling costs. The high and low levels of resource usage occurred in September and March for three different resources associated with materials handling. The number of moves is the driver. The total costs of the three resources and the activity output, as measured by moves for the two different levels, are presented as follows: Required: 1. Determine the cost behavior formula of each resource. Use the high-low method to assess the fixed and variable components. 2. Using your knowledge of cost behavior, predict the cost of each item for an activity output level of 9,000 moves. 3. Construct a cost formula that can be used to predict the total cost of the three resources combined. Using this formula, predict the total materials handling cost if activity output is 9,000 moves. In general, when can cost formulas be combined to form a single cost formula?arrow_forwardTwo departments within Cougar Gear Inc. are Production and Sales. Each department has a unique scorecard, as follows: The Production Department scorecard focuses on the learning and growth and internal processes perspectives. The Sales Department scorecard focuses on the learning and growth and customer perspectives. Both scorecards have the learning and growth performance metrics of median training hours per employee and average employee tenure. The Production scorecard has the unique metrics of production time per unit and number of production shutdowns. The Sales scorecard has the unique metrics of percentage of customers who shop again and online customer satisfaction rating. The performance targets for each metric are shown in the tan boxes just under the performance metrics. The actual achieved metrics are shown in the red boxes just below the tan boxes. When evaluating both departments, Cougar Gears management looks at the median training hours per employee and average employee tenure metrics and subsequently decides to give the Sales Department a large bonus while giving the Production Department a minimal bonus. a. Determine and define the type of cognitive bias Cougar Gears management has exhibited in this instance. b. Determine which department would have received the larger bonus had the companys management not been biased in the evaluation. c. Discuss one advantage and one disadvantage of using unique balanced scorecards for different departments or divisions of a company.arrow_forward
 Cornerstones of Cost Management (Cornerstones Ser...AccountingISBN:9781305970663Author:Don R. Hansen, Maryanne M. MowenPublisher:Cengage Learning
 Managerial AccountingAccountingISBN:9781337912020Author:Carl Warren, Ph.d. Cma William B. TaylerPublisher:South-Western College Pub
 Financial And Managerial AccountingAccountingISBN:9781337902663Author:WARREN, Carl S.Publisher:Cengage Learning,
 Principles of Accounting Volume 2AccountingISBN:9781947172609Author:OpenStaxPublisher:OpenStax College
 Managerial Accounting: The Cornerstone of Busines...AccountingISBN:9781337115773Author:Maryanne M. Mowen, Don R. Hansen, Dan L. HeitgerPublisher:Cengage Learning