
Managerial Accounting: The Cornerstone of Business Decision-Making
7th Edition
ISBN: 9781337115773
Author: Maryanne M. Mowen, Don R. Hansen, Dan L. Heitger
Publisher: Cengage Learning
expand_more
expand_more
format_list_bulleted
Videos
Textbook Question
Chapter 3, Problem 56E
(Appendix 3A) Method of Least Squares Using Computer Spreadsheet Program
Susan Lewis, owner of a florist shop, is interested in predicting the cost of delivering floral arrangements. She collected monthly data on the number of deliveries and the total monthly delivery cost (
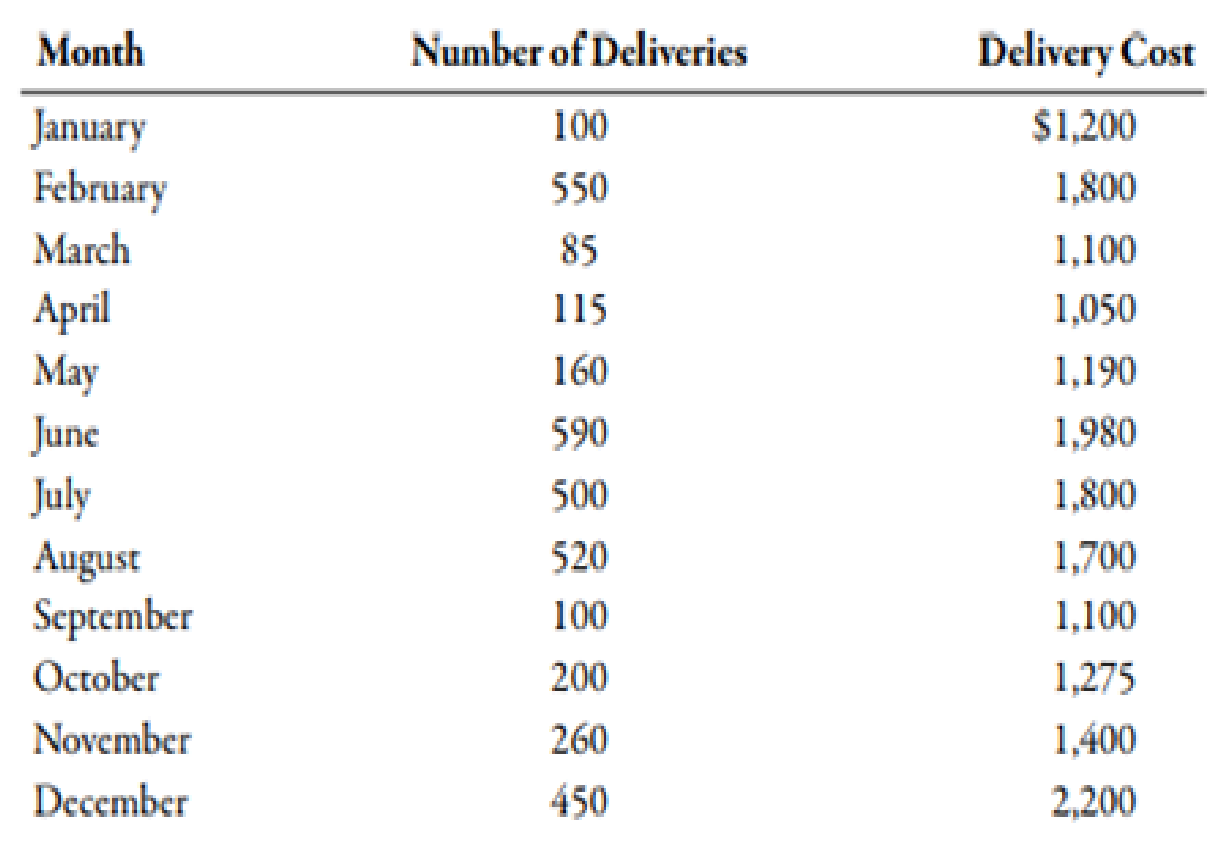
Required:
- 1. Using a computer spreadsheet program such as Excel, run a regression on these data. Print out your results.
- 2. Using your results from Requirement 1, write the cost formula for delivery cost. (Note: Round the fixed cost to the nearest dollar and the variable rate to the nearest cent.)
- 3. CONCEPTUAL CONNECTION What is R2 based on your results? Do you think that the number of direct labor hours is a good predictor of delivery cost?
- 4. Using the cost formula in Requirement 2, what would predicted delivery cost be for a month with 300 deliveries?
Expert Solution & Answer

Trending nowThis is a popular solution!

Students have asked these similar questions
A manufacturing plant wishes to buy a new equipment so the purchasing department did some research different types of this equipment. In the monthly meeting, the purchasing department presented a report about the two types of equipment that they have found. Pertinent data follows:
If the minimum required rate of return is 19%,
Nation’s Capital Fitness, Inc. operates a chain of fitness centers in the Washington, D.C., area. The firm’s controller is accumulating data to be used in preparing its annual profit plan for the coming year. The cost behavior pattern of the firm’s equipment maintenance costs must be determined. The accounting staff has suggested the use of an equation, in the form of Y = a + bX, for maintenance costs. Data regarding the maintenance hours and costs for last year are as follows: (image below)
Required:1. Using the high-low method of cost estimation, estimate the behavior of the maintenance costs incurred by Nation’s Capital Fitness, Inc. Express the cost behavior pattern in equation form.2. Using your answer to requirement (1), what is the variable component of the maintenance cost?3. Compute the predicted maintenance cost at 590 hours of activity.4. Compute the variable cost per hour and the fixed cost per hour at 600 hours of activity. Explain why the fixed cost per hour could be…
After a few hours May’s computer is fixed. May uses the first 9 months of data and regression analysis to estimate the relationship between the quantity purchased and purchase costs of part #696. The regression line May obtains is as follows: y = $2,582.6 + 3.54X
Evaluate the regression line using the criteria of economic plausibility, goodness of fit, and significance of the independent variable. Compare the regression equation to the equation based on the high-low method. Which is a better fit? Why?
Chapter 3 Solutions
Managerial Accounting: The Cornerstone of Business Decision-Making
Ch. 3 - Prob. 1DQCh. 3 - What is a driver? Give an example of a cost and...Ch. 3 - Suppose a company finds that shipping cost is...Ch. 3 - Some firms assign mixed costs to either the fixed...Ch. 3 - Explain the difference between committed and...Ch. 3 - Explain why the concept of relevant range is...Ch. 3 - Why do mixed costs pose a problem when it comes to...Ch. 3 - Describe the cost formula for a strictly fixed...Ch. 3 - Describe the cost formula for a strictly variable...Ch. 3 - What is the scattergraph method, and why is it...
Ch. 3 - Describe how the scattergraph method breaks out...Ch. 3 - What are the advantages of the scattergraph method...Ch. 3 - Prob. 13DQCh. 3 - What is meant by the best-fitting line?Ch. 3 - What is the difference between the unit cost of a...Ch. 3 - Prob. 16DQCh. 3 - (Appendix 3A) Explain the meaning of the...Ch. 3 - A factor that causes or leads to a change in a...Ch. 3 - Which of the following would probably be a...Ch. 3 - Prob. 3MCQCh. 3 - In the cost formula, the term 128,000,000 a. is...Ch. 3 - In the cost formula, the term 12,000 a. is the...Ch. 3 - Prob. 6MCQCh. 3 - Prob. 7MCQCh. 3 - The following cost formula for total purchasing...Ch. 3 - An advantage of the high-low method is that it a....Ch. 3 - Prob. 10MCQCh. 3 - Prob. 11MCQCh. 3 - Prob. 12MCQCh. 3 - The total cost for monthly supervisory cost in a...Ch. 3 - Yates Company shows the following unit costs for...Ch. 3 - (Appendix 3A) In the method of least squares, the...Ch. 3 - Creating and Using a Cost Formula Big Thumbs...Ch. 3 - Using High-Low to Calculate Fixed Cost, Calculate...Ch. 3 - Using High-Low to Calculate Predicted Total...Ch. 3 - Using High-Low to Calculate Predicted Total...Ch. 3 - Using Regression to Calculate Fixed Cost,...Ch. 3 - Inventory Valuation under Absorption Costing Refer...Ch. 3 - Inventory Valuation under Variable Costing Refer...Ch. 3 - Absorption-Costing Income Statement Refer to the...Ch. 3 - Variable-Costing Income Statement Refer to the...Ch. 3 - Creating and Using a Cost Formula Kleenaire Motors...Ch. 3 - Using High-Low to Calculate Fixed Cost, Calculate...Ch. 3 - Using High-Low to Calculate Predicted Total...Ch. 3 - Brief Exercise 3-28 Using High-Low to Calculate...Ch. 3 - Using Regression to Calculate Fixed Cost,...Ch. 3 - Inventory Valuation under Absorption Costing Refer...Ch. 3 - Inventory Valuation under Variable Costing Refer...Ch. 3 - Brief Exercise 3-32 Absorption-Costing Income...Ch. 3 - Brief Exercise 3-33 Variable-Costing Income...Ch. 3 - Variable and Fixed Costs What follows are a number...Ch. 3 - Cost Behavior, Classification Smith Concrete...Ch. 3 - Prob. 36ECh. 3 - Prob. 37ECh. 3 - Prob. 38ECh. 3 - Step Costs, Relevant Range Bellati Inc. produces...Ch. 3 - Matching Cost Behavior Descriptions to Cost...Ch. 3 - Examine the graphs in Exercise 3-40. Required: As...Ch. 3 - Prob. 42ECh. 3 - Prob. 43ECh. 3 - High-Low Method Refer to the information for Luisa...Ch. 3 - Scattergraph Method Refer to the information for...Ch. 3 - Method of Least Squares Refer to the information...Ch. 3 - Use the following information for Exercises 3-47...Ch. 3 - Use the following information for Exercises 3-47...Ch. 3 - Method of Least Squares, Developing and Using the...Ch. 3 - The method of least squares was used to develop a...Ch. 3 - Identifying the Parts of the Cost Formula;...Ch. 3 - Inventory Valuation under Absorption Costing...Ch. 3 - Inventory Valuation under Variable Costing Lane...Ch. 3 - Income Statements under Absorption and Variable...Ch. 3 - (Appendix 3A) Method of Least Squares Using...Ch. 3 - (Appendix 3A) Method of Least Squares Using...Ch. 3 - Identifying Fixed, Variable, Mixed, and Step Costs...Ch. 3 - Identifying Use of the High-Low, Scattergraph, and...Ch. 3 - Identifying Variable Costs, Committed Fixed Costs,...Ch. 3 - Scattergraph, High-Low Method, and Predicting Cost...Ch. 3 - Method of Least Squares, Predicting Cost for...Ch. 3 - Cost Behavior, High-Low Method, Pricing Decision...Ch. 3 - Prob. 63PCh. 3 - Variable and Fixed Costs, Cost Formula, High-Low...Ch. 3 - Cost Separation About 8 years ago, Kicker faced...Ch. 3 - Variable-Costing and Absorption-Costing Income...Ch. 3 - Refer to the information for Farnsworth Company...Ch. 3 - (Appendix 3A) Scattergraph, High-Low Method,...Ch. 3 - (Appendix 3A) Separating Fixed and Variable Costs,...Ch. 3 - (Appendix 3A) Cost Formulas, Single and Multiple...Ch. 3 - Suspicious Acquisition of Data, Ethical Issues...
Knowledge Booster


Learn more about
Need a deep-dive on the concept behind this application? Look no further. Learn more about this topic, accounting and related others by exploring similar questions and additional content below.Similar questions
- Method of Least Squares Refer to the information for Luisa Crimini on the previous page. Required: 1. Using a computer spreadsheet program such as Excel, run a regression on these data. Based on the regression output, write the cost formula for tanning. (Note: Round the fixed cost to the nearest dollar and the variable rate to the nearest cent.) 2. Using the formula computed in Requirement 1, what is the predicted cost of tanning services for September for 2,500 appointments? Use the following information for Exercises 3-44 through 3-46: Luisa Crimini has been operating a beauty shop in a college town for the past 10 years. Recently, Luisa rented space next to her shop and opened a tanning salon. She anticipated that the costs for the tanning service would primarily be fixed, but found that tanning salon costs increased with the number of appointments. Costs for this service over the past 8 months are as follows:arrow_forwardJohnson Filtration. Inc., provides maintenance service for water filtration systems throughout southern Florida. Customers contact Johnson with requests for maintenance service on their water filtration systems. To estimate the service time and the service cost. Johnson’s managers want to predict the repair time necessary for each maintenance request. Hence, repair time in hours is the dependent variable. Repair time is believed to be related to three factors: the number of months since the last maintenance service, the type of repair problem (mechanical or electrical), and the repairperson who performs the repair (Donna Newton or Bob Jones). Data for a sample of 10 service calls are reported in the following table: Develop the simple linear regression equation to predict repair time given the number of months since the last maintenance service, and use the results to test the hypothesis that no relationship exists between repair time and the number of months since the last maintenance service at the 0.05 level of significance. What is the interpretation of this relationship? What does the coefficient of determination tell you about this model? Using the simple linear regression model developed in part (a), calculate the predicted repair time and residual for each of the 10 repairs in the data. Sort the data in ascending order by value of the residual. Do you see any pattern in the residuals for the two types of repair? Do you see any pattern in the residuals for the two repairpersons? Do these results suggest any potential modifications to your simple linear regression model? Now create a scatter chart with months since last service on the x-axis and repair time in hours on the y-axis for which the points representing electrical and mechanical repairs are shown in different shapes and/or colors. Create a similar scatter chart of months since last service and repair time in hours for which the points representing repairs by Bob Jones and Donna Newton are shown in different shapes and/or colors. Do these charts and the results of your residual analysis suggest the same potential modifications to your simple linear regression model? Create a new dummy variable that is equal to zero if the type of repair is mechanical and one if the type of repair is electrical. Develop the multiple regression equation to predict repair time, given the number of months since the last maintenance service and the type of repair. What are the interpretations of the estimated regression parameters? What does the coefficient of determination tell you about this model? Create a new dummy variable that is equal to zero if the repairperson is Bob Jones and one if the repairperson is Donna Newton. Develop the multiple regression equation to predict repair time, given the number of months since the last maintenance service and the repairperson. What are the interpretations of the estimated regression parameters? What does the coefficient of determination tell you about this model? Develop the multiple regression equation to predict repair time, given the number of months since the last maintenance service, the type of repair, and the repairperson. What are the interpretations of the estimated regression parameters? What does the coefficient of determination tell you about this model? Which of these models would you use? Why?arrow_forwardThe Port Authority sells a wide variety of cables and adapters for electronic equipment online. Last year the mean value of orders placed with the Port Authority was 47.28, and management wants to assess whether the mean value of orders placed to date this year is the same as last year. The values of a sample of 49,896 orders placed this year are collected and recorded in the tile PortAuthority. a. Formulate hypotheses that can be used to test whether the mean value of orders placed this year differs from the mean value of orders placed last year. b. Use the data in the file PortAuthority to conduct your hypothesis test. What is the p value for your hypothesis test? At = 0.01, what is your conclusion?arrow_forward
- The Lockit Company manufactures door knobs for residential homes and apartments. Lockit is considering the use of simple (single-driver) and multiple regression analyses to forecast annual sales because previous forecasts have been inaccurate. The new sales forecast will be used to initiate the budgeting process and to identify more completely the underlying process that generates sales. Larry Husky, the controller of Lockit, has considered many possible independent variables and equations to predict sales and has narrowed his choices to four equations. Husky used annual observations from 20 prior years to estimate each of the four equations. Following are definitions of the variables used in the four equations and a statistical summary of these equations: St=ForecastedsalesindollarsforLockitinperiodtSt1=ActualsalesindollarsforLockitinperiodt1Gt=ForecastedU.S.grossdomesticproductinperiodtGt1=ActualU.S.grossdomesticproductinperiodt1Nt1=Lockitsnetincomeinperiodt1 Required: 1. Write Equations 2 and 4 in the form Y = a + bx. 2. If actual sales are 1,500,000 in the current year, what would be the forecasted sales for Lockit in the coming year? 3. Explain why Larry Husky might prefer Equation 3 to Equation 2. 4. Explain the advantages and disadvantages of using Equation 4 to forecast sales.arrow_forwardThe owner of an automobile repair shop studied the waiting times for customers who arrive at the shop for an oil change. The following data with waiting times in minutes were collected over a 1-month period. 2 5 10 12 4 4 5 17 11 8 9 8 12 21 6 8 7 13 18 3 Using classes of 04, 59, and so on, show: a. The frequency distribution. b. The relative frequency distribution. c. The cumulative frequency distribution. d. The cumulative relative frequency distribution. e. The proportion of customers needing an oil change who wait 9 minutes or less.arrow_forwardJean and Tom Perritz own and manage Happy Home Helpers, Inc. (HHH), a house-cleaning service. Each cleaning (cleaning one house one time) takes a team of three house cleaners about 1.5 hours. On average, HHH completes about 15,000 cleanings per year. The following total costs are associated with the total cleanings: Required: 1. Calculate the prime cost per cleaning. 2. Calculate the conversion cost per cleaning. 3. Calculate the total variable cost per cleaning. 4. Calculate the total service cost per cleaning. 5. What if rent on the office that Jean and Tom use to run HHH increased by 1,500? Explain the impact on the following: a. Prime cost per cleaning b. Conversion cost per cleaning c. Total variable cost per cleaning d. Total service cost per cleaningarrow_forward
- Refer to Cornerstone Exercise 3.4 for data on Dohini Manufacturing Companys purchasing cost and number of purchase orders. The controller for Dohini Manufacturing ran regression on the data, and the coefficients shown by the regression program are: Required: 1. Construct the cost formula for the purchasing activity showing the fixed cost and the variable rate. 2. If Dohini Manufacturing Company estimates that next month will have 430 purchase orders, what is the total estimated purchasing cost for that month? (Round your answer to the nearest dollar.) 3. What if Dohini Manufacturing wants to estimate purchasing cost for the coming year and expects 5,340 purchase orders? What will estimated total purchasing cost be? (Round your answer to the nearest dollar.) What is the total fixed purchasing cost? Why doesnt it equal the fixed cost calculated in Requirement 1?arrow_forwardThe controller for Dohini Manufacturing Company felt that the number of purchase orders alone did not explain the monthly purchasing cost. He knew that nonstandard orders (for example, one requiring an overseas supplier) took more time and effort. He collected data on the number of nonstandard orders for the past 12 months and added that information to the data on purchasing cost and total number of purchase orders. Multiple regression was run on the above data; the coefficients shown by the regression program are: Required: 1. Construct the cost formula for the purchasing activity showing the fixed cost and the variable rate. 2. If Dohini Manufacturing Company estimates that next month will have 430 total purchase orders and 45 nonstandard orders, what is the total estimated purchasing cost for that month? (Round your answer to the nearest dollar.) 3. What if Dohini Manufacturing wants to estimate purchasing cost for the coming year and expects 5,340 purchase orders and 580 nonstandard orders? What will estimated total purchasing cost be? What is the total fixed purchasing cost? Why doesnt it equal the fixed cost calculated in Requirement 2? (Round your answers to the nearest dollar.)arrow_forwardNote that Barbaras Bistro in Figure 1-2 prepares monthly performance reports. Do you think that it would be a good idea for Barbara to switch to just an annual performance report in an effort to reduce its accounting costs?arrow_forward
- The regional transit authority for a major metropolitan area wants to determine whether there is a relationship between the age of a bus and the annual maintenance cost. A sample of 10 buses resulted in the following data: Develop a scatter chart for these data. What does the scatter chart indicate about the relationship between age of a bus and the annual maintenance cost? Use the data to develop an estimated regression equation that could be used to predict the annual maintenance cost given the age of the bus. What is the estimated regression model? Test whether each of the regression parameters β0 and β1 is equal to zero at a 0.05 level of significance. What are the correct interpretations of the estimated regression parameters? Are these interpretations reasonable? How much of the variation in the sample values of annual maintenance cost does the model you estimated in part (b) explain? What do you predict the annual maintenance cost to be for a 3.5-year-old bus?arrow_forwardSuppose that Demont has been given a summer job as an intern at Isaac Aircams, a company that manufactures sophisticated spy cameras for remote-controlled military reconnaissance aircraft. The company, which is privately owned, has approached a bank for a loan to help it finance its growth. The bank requires financial statements before approving such a loan. Classify each cost listed below as either product costs or period costs for the purpose of preparing the financial statements for the bank. Costs Product Cost/Period Cost 1. Depreciated on salesperson's cars 2. Rent on equipment used in the factory 3. Lubricants used for machine maintenance 4. Salaries of personnel who work in the finished goods warehouse 5. Soap and paper towels used by factory workers at the end of a shiftarrow_forwardSandy, the owner of Sunshine Car Wash has found that her income changes depending on the number of cars she washes per month. Sandy wants to predict what her costs are going to be in the future, and has asked you to assist her with some calculations. She has given you the following information for the previous three months: September October NovemberNumber of cars washed 1 500 1 900 2 000Income for the month R61 000 R63 500 R76 000 Required:a) Use the high-low method to calculate the variable cost per unit. b) Use the high-low method to calculate the fixed cost per month c) Use the answers from questions a and b to predict the total cost for December if Sandy washes 2 200 cars.arrow_forward
arrow_back_ios
SEE MORE QUESTIONS
arrow_forward_ios
Recommended textbooks for you
 Managerial Accounting: The Cornerstone of Busines...AccountingISBN:9781337115773Author:Maryanne M. Mowen, Don R. Hansen, Dan L. HeitgerPublisher:Cengage Learning
 Cornerstones of Cost Management (Cornerstones Ser...AccountingISBN:9781305970663Author:Don R. Hansen, Maryanne M. MowenPublisher:Cengage Learning
 Essentials of Business Analytics (MindTap Course ...StatisticsISBN:9781305627734Author:Jeffrey D. Camm, James J. Cochran, Michael J. Fry, Jeffrey W. Ohlmann, David R. AndersonPublisher:Cengage Learning
 Excel Applications for Accounting PrinciplesAccountingISBN:9781111581565Author:Gaylord N. SmithPublisher:Cengage Learning
 Principles of Cost AccountingAccountingISBN:9781305087408Author:Edward J. Vanderbeck, Maria R. MitchellPublisher:Cengage Learning
Managerial Accounting: The Cornerstone of Busines...
Accounting
ISBN:9781337115773
Author:Maryanne M. Mowen, Don R. Hansen, Dan L. Heitger
Publisher:Cengage Learning
Cornerstones of Cost Management (Cornerstones Ser...
Accounting
ISBN:9781305970663
Author:Don R. Hansen, Maryanne M. Mowen
Publisher:Cengage Learning
Essentials of Business Analytics (MindTap Course ...
Statistics
ISBN:9781305627734
Author:Jeffrey D. Camm, James J. Cochran, Michael J. Fry, Jeffrey W. Ohlmann, David R. Anderson
Publisher:Cengage Learning
Excel Applications for Accounting Principles
Accounting
ISBN:9781111581565
Author:Gaylord N. Smith
Publisher:Cengage Learning
Principles of Cost Accounting
Accounting
ISBN:9781305087408
Author:Edward J. Vanderbeck, Maria R. Mitchell
Publisher:Cengage Learning
How to Estimate Project Costs: A Method for Cost Estimation; Author: Online PM Courses - Mike Clayton;https://www.youtube.com/watch?v=YQ2Wi3Jh3X0;License: Standard Youtube License