
Concept explainers
Videos
Scattergraph, High-Low Method, and Predicting Cost for a Different Time Period from the One Used to Develop a Cost Formula
Refer to the information for Farnsworth Company on the previous page.
Required:
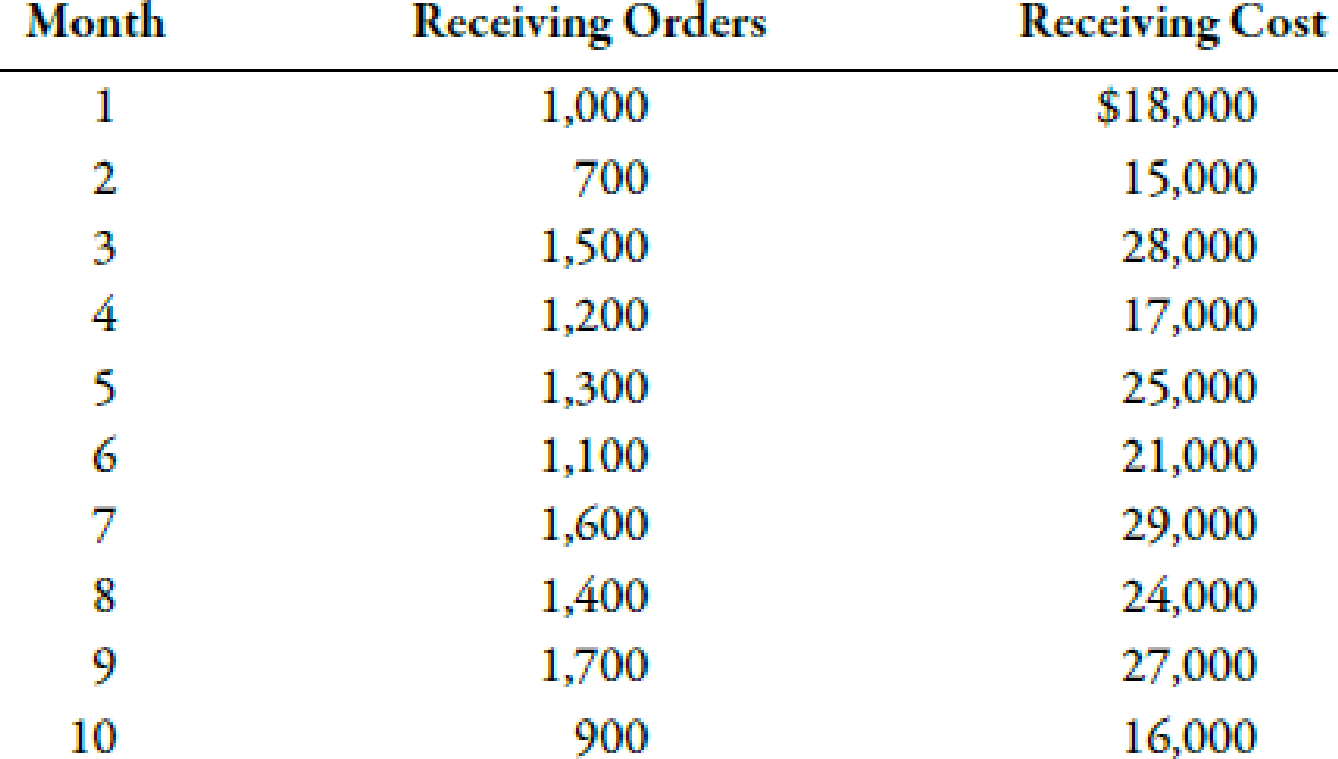
- 1. Prepare a scattergraph based on the 10 months of data. Does the relationship appear to be linear?
- 2. Using the high-low method, prepare a cost formula for the receiving activity. Using this formula, what is the predicted cost of receiving for a month in which 1,450 receiving orders are processed?
- 3. Prepare a cost formula for the receiving activity for a quarter. Based on this formula, what is the predicted cost of receiving for a quarter in which 4,650 receiving orders are anticipated? Prepare a cost formula for the receiving activity for a year. Based on this formula, what is the predicted cost of receiving for a year in which 18,000 receiving orders are anticipated?
Use the following information for Problems 3-60 and 3-61:
Farnsworth Company has gathered data on its overhead activities and associated costs for the past 10 months. Tracy Heppler, a member of the controller’s department, has convinced management that overhead costs can be better estimated and controlled if the fixed and variable components of each overhead activity are known. One such activity is receiving raw materials (unloading incoming goods, counting goods, and inspecting goods), which she believes is driven by the number of receiving orders. Ten months of data have been gathered for the receiving activity and are as follows:

Trending nowThis is a popular solution!

Chapter 3 Solutions
Managerial Accounting: The Cornerstone of Business Decision-Making


- Method of Least Squares, Predicting Cost for Different Time Periods from the One Used to Develop a Cost Formula Refer to the information for Farnsworth Company on the previous page. However, assume that Tracy has used the method of least squares on the receiving data and has gotten the following results: Required: 1. Using the results from the method of least squares, prepare a cost formula for the receiving activity. 2. Using the formula from Requirement 1, what is the predicted cost of receiving for a month in which 1,450 receiving orders are processed? (Note: Round your answer to the nearest dollar.) 3. Prepare a cost formula for the receiving activity for a quarter. Based on this formula, what is the predicted cost of receiving for a quarter in which 4,650 receiving orders are anticipated? Prepare a cost formula for the receiving activity for a year. Based on this formula, what is the predicted cost of receiving for a year in which 18,000 receiving orders are anticipated?arrow_forwardUsing Regression to Calculate Fixed Cost, Calculate the Variable Rate, Construct a Cost Formula, and Determine Budgeted Cost Refer to the information for Pizza Vesuvio on the previous page. Coefficients shown by a regression program for Pizza Vesuvios data are: Required: Use the results of regression to make the following calculations: 1. Calculate the fixed cost of labor and the variable rate per employee hour. 2. Construct the cost formula for total labor cost. 3. Calculate the budgeted cost for next month, assuming that 675 employee hours are budgeted. (Note: Round answers to the nearest dollar.) Use the following information for Brief Exercises 3-17 through 3-20: Pizza Vesuvio makes specialty pizzas. Data for the past 8 months were collected:arrow_forwardUsing Regression to Calculate Fixed Cost, Calculate the Variable Rate, Construct a Cost Formula, and Determine Budgeted Cost Refer to the information for Speedy Petes on the previous page. Coefficients shown by a regression program for Speedy Petes data are: Required: Use the results of regression to make the following calculations: 1. Calculate the fixed cost of deliveries and the variable rate per delivery. 2. Construct the cost formula for total delivery cost. 3. Calculate the budgeted cost for next month, assuming that 3,000 deliveries are budgeted. (Note: Round answers to the nearest dollar.) Use the following information for Brief Exercises 3-26 through 3-29: Speedy Petes is a small start-up company that delivers high-end coffee drinks to large metropolitan office buildings via a cutting-edge motorized coffee cart to compete with other premium coffee shops. Data for the past 8 months were collected as follows:arrow_forward
- Summarized data for Backdraft Co. for its first year of operations are as follows: A. Prepare an income statement under absorption costing B. Prepare an income statement under variable costingarrow_forwardHigh-low method The manufacturing costs of Rosenthal Industries for the first three months of the year follow: Using the high-low method, determine (a) the variable cost per unit and (b) the total fixed cost.arrow_forwardScattergraph method Using the data in P4-2 and a piece of graph paper: 1. Plot the data points on the graph and draw a line by visual inspection, indicating the trend shown by the data points. 2. Determine the variable cost per unit and the total fixed cost from the information on the graph. 3. Determine the variable cost to be charged to the product for the year. 4. Determine the fixed cost to be charged to factory overhead for the year. 5. Do these answers agree with the answers to P4-2? Why or why not?arrow_forward
- Identify cost graphs The following cost graphs illustrate various types of cost behavior: For each of the following costs, identify the cost graph that best illustrates its cost behavior as the number of units produced increases: A. Total direct materials cost B. Electricity costs of 1,000 per month plus 0.10 per kilowatt-hour C. Per-unit cost of straight-line depreciation on factory equipment D. Salary of quality control supervisor, 20,000 per month E. Per-unit direct labor costarrow_forwardVariable-Costing Income Statement Refer to the data for Osterman Company on the previous page. Required: 1. Calculate the cost of goods sold under variable costing. 2. Prepare an income statement using variable costing. Use the following information for Brief Exercises 3-23 and 3-24: During the most recent year, Osterman Company had the following data:arrow_forwardGrand Canyon Manufacturing Inc. produces and sells a product with a price of 100 per unit. The following cost data have been prepared for its estimated upper and lower limits of activity: Overhead: Selling and administrative expenses: Required: 1. Classify each cost element as either variable, fixed, or semi-variable. (Hint: Recall that variable expenses must go up in direct proportion to changes in the volume of activity.) 2. Calculate the break-even point in units and dollars. (Hint: First use the high-low method illustrated in Chapter 4 to separate costs into their fixed and variable components.) 3. Prepare a break-even chart. 4. Prepare a contribution income statement, similar in format to the statement appearing on page 540, assuming sales of 5,000 units. 5. Recompute the break-even point in units, assuming that variable costs increase by 20% and fixed costs are reduced by 50,000.arrow_forward
- Using the information in the previous exercises about Marleys Manufacturing, determine the operating income for department B, assuming department A sold department B 1,000 units during the month and department A reduces the selling price to the market price.arrow_forwardUsing the data in P4-2 and Microsoft Excel: 1. Separate the variable and fixed elements. 2. Determine the cost to be charged to the product for the year. 3. Determine the cost to be charged to factory overhead for the year. 4. Determine the plotted data points using Chart Wizard. 5. Determine R2. 6. How do these solutions compare to the solutions in P4-2 and P4-3? 7. What does R2 tell you about this cost model?arrow_forwardCost Classification Loring Company incurred the following costs last year: Required: 1. Classify each of the costs using the following table format. Be sure to total the amounts in each column. Example: Direct materials, 216,000. 2. What was the total product cost for last year? 3. What was the total period cost for last year? 4. If 30,000 units were produced last year, what was the unit product cost?arrow_forward
 Managerial Accounting: The Cornerstone of Busines...AccountingISBN:9781337115773Author:Maryanne M. Mowen, Don R. Hansen, Dan L. HeitgerPublisher:Cengage Learning
 Principles of Cost AccountingAccountingISBN:9781305087408Author:Edward J. Vanderbeck, Maria R. MitchellPublisher:Cengage Learning
 Excel Applications for Accounting PrinciplesAccountingISBN:9781111581565Author:Gaylord N. SmithPublisher:Cengage Learning
 Managerial AccountingAccountingISBN:9781337912020Author:Carl Warren, Ph.d. Cma William B. TaylerPublisher:South-Western College Pub
 Essentials of Business Analytics (MindTap Course ...StatisticsISBN:9781305627734Author:Jeffrey D. Camm, James J. Cochran, Michael J. Fry, Jeffrey W. Ohlmann, David R. AndersonPublisher:Cengage Learning
 Financial And Managerial AccountingAccountingISBN:9781337902663Author:WARREN, Carl S.Publisher:Cengage Learning,