6 1 5 3 7 3 0 3 1 3 4 1 2 4 1 0 5 6 3 1


Inverse Normal Distribution
The method used for finding the corresponding z-critical value in a normal distribution using the known probability is said to be an inverse normal distribution. The inverse normal distribution is a continuous probability distribution with a family of two parameters.
Mean, Median, Mode
It is a descriptive summary of a data set. It can be defined by using some of the measures. The central tendencies do not provide information regarding individual data from the dataset. However, they give a summary of the data set. The central tendency or measure of central tendency is a central or typical value for a probability distribution.
Z-Scores
A z-score is a unit of measurement used in statistics to describe the position of a raw score in terms of its distance from the mean, measured with reference to standard deviation from the mean. Z-scores are useful in statistics because they allow comparison between two scores that belong to different normal distributions.
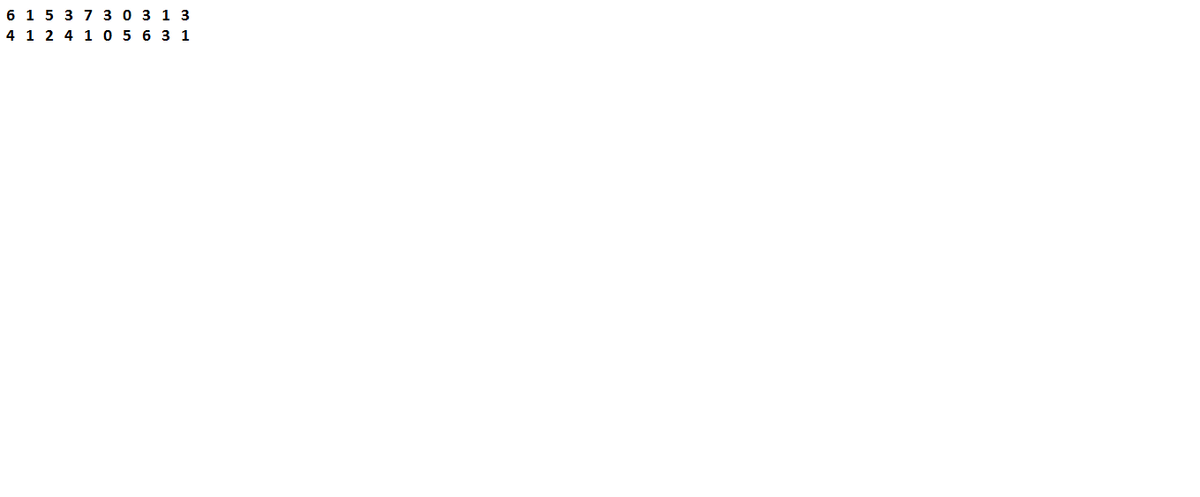
The average number of times Americans dine out in a week fell from 4.0 in 2008 to 3.8 in 2012 (Zagat.com, April, 2012). The number of times a sample of 20 families dined out last week provides the following data.
a. Compute the mean and median.b. Compute the first and third quartiles.
c. Compute the
d. Compute the variance and standard deviation.
e. The skewness measure for these data is 0.34. Comment on the shape of this distribution. Is it the shape you would expect? Why or why not?
f. Do the data contain outliers?


Trending now
This is a popular solution!

Step by step
Solved in 6 steps


