Essentials Of Statistics For Business & Economics
9th Edition
ISBN: 9780357045435
Author: David R. Anderson, Dennis J. Sweeney, Thomas A. Williams, Jeffrey D. Camm, James J. Cochran
Publisher: South-Western College Pub
expand_more
expand_more
format_list_bulleted
Textbook Question
Chapter 3, Problem 64SE
Physician Office Waiting Times. The average waiting time for a patient at an El Paso physician’s office is just over 29 minutes, well above the national average of 21 minutes. In order to address the issue of long patient wait times, some physician’s offices are using wait tracking systems to notify patients of expected wait times. Patients can adjust their arrival times based on this information and spend less time in waiting rooms. The following data show wait times (minutes) for a sample of patients at offices that do not have an office tracking system and wait times for a sample of patients at offices with an office tracking system.
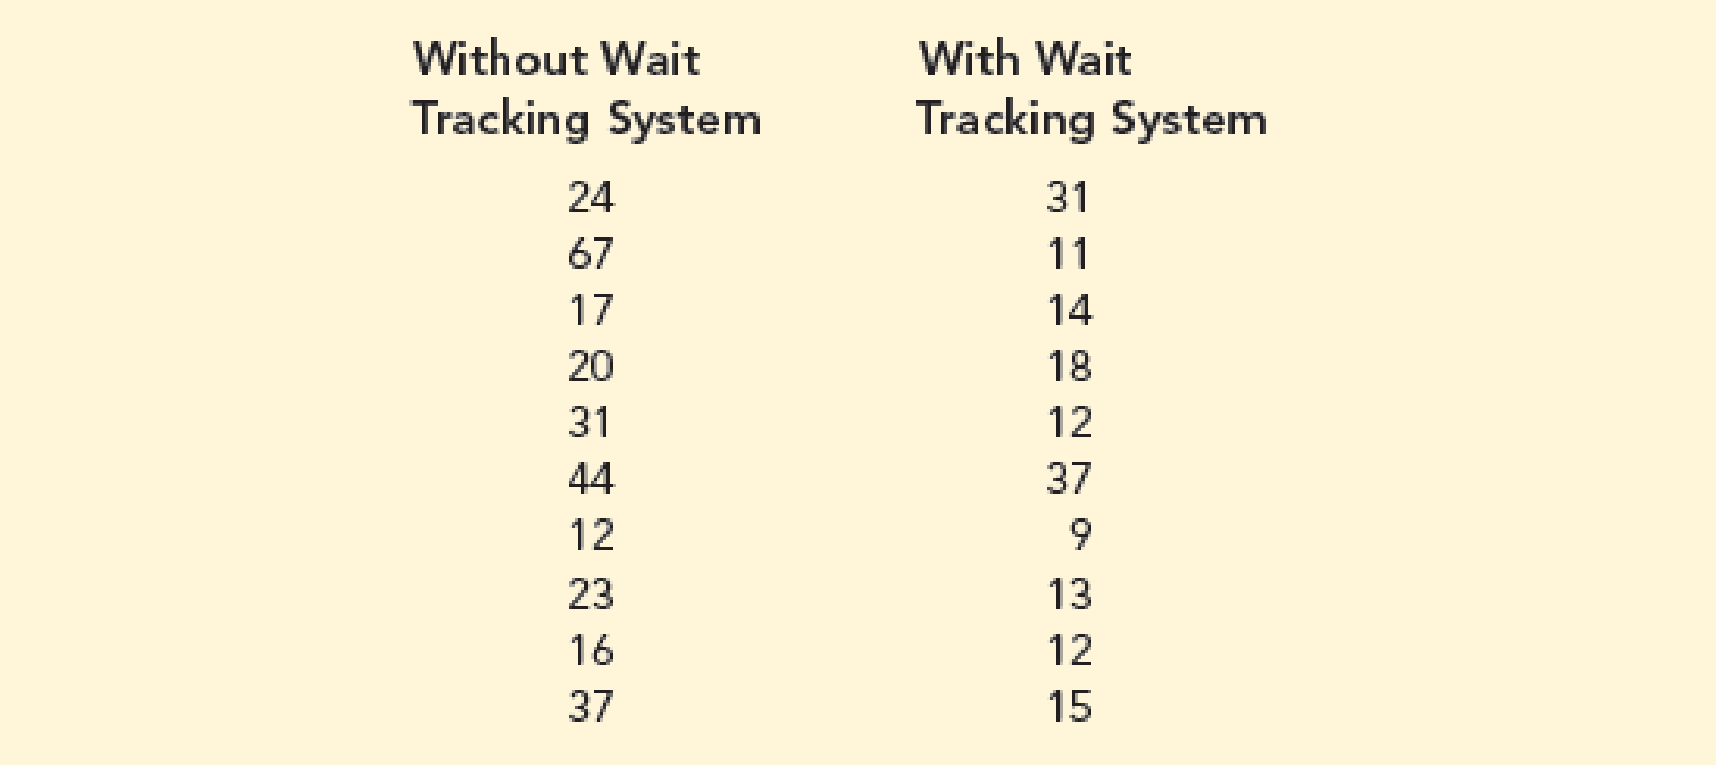
- a. What are the
mean andmedian patient wait times for offices with a wait tracking system? What are the mean and median patient wait times for offices without a wait tracking system? - b. What are the variance and standard deviation of patient wait times for offices with a wait tracking system? What are the variance and standard deviation of patient wait times for visits to offices without a wait tracking system?
- c. Do offices with a wait tracking system have shorter patient wait times than offices without a wait tracking system? Explain.
- d. Considering only offices without a wait tracking system, what is the z-score for the tenth patient in the sample?
- e. Considering only offices with a wait tracking system, what is the z-score for the sixth patient in the sample? How does this z-score compare with the z-score you calculated for part (d)?
- f. Based on z-scores, do the data for offices without a wait tracking system contain any outliers? Based on z-scores, do the data for offices with a wait tracking system contain any outliers?
Expert Solution & Answer

Trending nowThis is a popular solution!

Students have asked these similar questions
Due: Tue
00 35 --
Resources
Next Question
HR MIN SEC
X Question 17 of 20 >
Macmillan Learning
Veterinarians suspect that enteroliths, calcifications in the gut of horses, are related to diet-in particular, alfalfa. To investigate
this suspicion, a group of veterinarians collected information on the diet of horses and whether the horses developed enteroliths.
The table displays the findings.
less than 25% alfalfa in diet
25%-50% alfalfa in diet
greater than 50% alfalfa in die
Total
3
Has enteroliths
0.05
Does not have enteroliths
0.40
Total
0.07
0.25
0.08
0.20
0.15
0.80
0.45
0.32
0.23
1
The probability that a randomly selected horse has enteroliths given that it is fed more than 50% alfalfa is:
○ 0.08.
0.23.
○ 0.2.
○ 0.348.
95
MacBook Air
Dil
7
8
9
0
D
F10
GE
+900 pts
/1100
Due: Tue
Submit Answer
Many young men in North America and Europe (but not in Asia) tend to think they need more muscle to be attractive. One
study presented 200 young American men with 100 images of men with various levels of muscle. Researchers measure level of
muscle in kilograms per square meter (kg/m²) of fat-free body mass. Typical young men have about 20 kg/m². Each subject
chose two images, one that represented his own level of body muscle and one that he thought represented "what women prefer."
The mean gap between self-image and "what women prefer" was 2.35 kg/m².
Suppose that the "muscle gap" in the population of all young men has a Normal distribution with standard deviation 2.5 kg/m²
Give a 90% confidence interval for the mean amount of muscle
think they should add to be attractive to women
(Enter your answers rounded to four decimal places.)
young
00
ible
lower limit =
00
upper limit =
00
00
100
100
3
#
E
80
DOD
F4
$
94
55
6
MacBook Air
R
T
Y
kg/m²
kg/m²…
Is the normal distribution important in statistics analysis? If yes, why? If no, why?
Is the normal distribution always being defined by its mean and standard deviation? Discuss.
Discuss with examples
c) Graphs illustrating the problems and solutions are recommended
Chapter 3 Solutions
Essentials Of Statistics For Business & Economics
Ch. 3.1 - Consider a sample with data values of 10, 20, 12,...Ch. 3.1 - Consider a sample with data values of 10, 20, 21,...Ch. 3.1 - Consider the following data and corresponding...Ch. 3.1 - Consider the following data.
What is the mean...Ch. 3.1 - Consider a sample with data values of 27, 25, 20,...Ch. 3.1 - Consider a sample with data values of 53, 55, 70,...Ch. 3.1 - eICU Waiting Times. There is a severe shortage of...Ch. 3.1 - Middle-Level Manager Salaries. Suppose that an...Ch. 3.1 - Advertising Spending. Which companies spend the...Ch. 3.1 - Advertising Spending. Which companies spend the...
Ch. 3.1 - Time Spent Watching Traditional TV. Nielsen tracks...Ch. 3.1 - Online Multiplayer Game Downloads. The creator of...Ch. 3.1 - Automobile Fuel Efficiencies. In automobile...Ch. 3.1 - Unemployment Rates by State. The U.S. Bureau of...Ch. 3.1 - Motor Oil Prices. Martinez Auto Supplies has...Ch. 3.1 - Calculating Grade Point Averages. The grade point...Ch. 3.1 - The following table shows the total return and the...Ch. 3.1 - Business School Ranking. Based on a survey of...Ch. 3.1 - Revenue Growth Rate. Annual revenue for Corning...Ch. 3.1 - Mutual Fund Comparison. Suppose that at the...Ch. 3.1 - If an asset declines in value from $5000 to $3500...Ch. 3.1 - The current value of a company is 25 million. If...Ch. 3.2 - Consider a sample with data values of 10, 20, 12,...Ch. 3.2 - Consider a sample with data values of 10, 20, 12,...Ch. 3.2 - Consider a sample with data values of 27, 25, 20,...Ch. 3.2 - Price of Unleaded Gasoline. Data collected by the...Ch. 3.2 - Round-Trip Flight Prices. The following table...Ch. 3.2 - Annual Sales Amounts. Varatta Enterprises sells...Ch. 3.2 - Air Quality Index. The Los Angeles Times regularly...Ch. 3.2 - Prob. 30ECh. 3.2 - Cellular Phone Spending. According to the 2016...Ch. 3.2 - Advertising Spend by Companies. Advertising Age...Ch. 3.2 - Amateur Golfer Scores. Scores turned in by an...Ch. 3.2 - Consistency of Running Times. The following times...Ch. 3.3 - Consider a sample with data values of 10, 20, 12,...Ch. 3.3 - Prob. 36ECh. 3.3 - Consider a sample with a mean of 30 and a standard...Ch. 3.3 - Suppose the data have a bell-shaped distribution...Ch. 3.3 - The results of a national survey showed that on...Ch. 3.3 - Price per Gallon of Gasoline. Suppose that the...Ch. 3.3 - GMAT Exam Scores. The Graduate Management...Ch. 3.3 - Many families in California are using backyard...Ch. 3.3 - Best Places to Live. Each year Money magazine...Ch. 3.3 - NCAA Basketball Game Scores. A sample of 10 NCAA...Ch. 3.3 - Prob. 45ECh. 3.4 - Consider a sample with data values of 27, 25, 20,...Ch. 3.4 - Show the boxplot for the data in exercise 46. 46....Ch. 3.4 - Prob. 48ECh. 3.4 - Prob. 49ECh. 3.4 - Naples Half-Marathon Times. Naples, Florida, hosts...Ch. 3.4 - Pharmaceutical Company Sales. Annual sales, in...Ch. 3.4 - Cell Phone Companies Customer Satisfaction....Ch. 3.4 - Most Admired Companies. Fortune magazines list of...Ch. 3.4 - U.S. Border Crossings. The Bureau of...Ch. 3.5 - Five observations taken for two variables follow....Ch. 3.5 - Five observations taken for two variables follow....Ch. 3.5 - Stock Price Comparison. The file StockComparison...Ch. 3.5 - Driving Speed and Fuel Efficiency. A department of...Ch. 3.5 - Smoke Detector Use and Death Rates. Over the past...Ch. 3.5 - Stock Market Indexes Comparison. The Russell 1000...Ch. 3.5 - Best Private Colleges. A random sample of 30...Ch. 3 - Americans Dining Out. Americans tend to dine out...Ch. 3 - NCAA Football Coaches Salaries. A 2017 USA Today...Ch. 3 - Physician Office Waiting Times. The average...Ch. 3 - Worker Productivity and Insomnia. U.S. companies...Ch. 3 - Work Commuting Methods. Public transportation and...Ch. 3 - Household Incomes. The following data represent a...Ch. 3 - Prob. 69SECh. 3 - Best Hotels. Travel + Leisure magazine provides an...Ch. 3 - NFL Teams Worth. In 2014, the 32 teams in the...Ch. 3 - MLB Team Winning Percentages. Does a major league...Ch. 3 - Money Market Funds Days to Maturity. The days to...Ch. 3 - Automobile Speeds. Automobiles traveling on a road...Ch. 3 - Annual Returns for Panama Railroad Company Stock....Ch. 3 - Pelican Stores, a division of National Clothing,...Ch. 3 - Prob. 2CPCh. 3 - The pursuit of a higher education degree in...Ch. 3 - Although millions of elephants once roamed across...
Knowledge Booster
Learn more about
Need a deep-dive on the concept behind this application? Look no further. Learn more about this topic, statistics and related others by exploring similar questions and additional content below.Similar questions
- Final grades The data show the final grades for 16 randomly selected students in College Algebra and Statistics. Find the y- value for the specified x-value. Remember that no regression should be done when r is not significant. Student 2 3 4 5 6 7 8 College 89 56 99 61 74 57 98 95 HARRERS 75 55 64 62 80 70 93 91 Student 9 10 11 12 13 14 15 16 College 98 87 89 73 66 88 79 56 SABERS 92 71 89 79 76 78 68 57 Send data to Excel The correlation coefficient for the data is r=0.684 and a=0.01. Should regression analysis be done? The regression analysis should not be done. The regression analysis should be done. Find the equation of the regression line. Round the coefficients to at least three decimal places. y'=a+bx a = b= Find the predicted grade in Statistics when the College Algebra grade was 86. Round the answer to at least three decimal places. When a student gets 86 in College Algebra, we predict a, Statistics score of . Continue × G Subnet Assignment F4 F5 95 ཀུན DII D F6 F7 FB F9 F10…arrow_forward= 5 6 = 7 8 9 10 11 12 13 14 15 16 Emergency Escape Plan A random sample of 180 residents of the Southeastern United States found 117 had no emergency escape plan for severe weather. Find the 90% confidence interval of the true proportion of individuals living in the Southeastern United States who do not have an emergency escape plan for severe weather. Use a graphing calculator. Round your answers to three decimal places. X 1 G Continue Q * F2 A 2 N # *3 80 a F3 F4 FS $ 54 % 5 + 80 G H J 9 K B N M F11 יד F12 0 P } 1 L ... Λ . H command option.arrow_forwardCigarette Smoking A researcher found that a cigarette smoker smokes on average 31 cigarettes a day. She feels that this average is too high. She selected a random sample of 8 smokers and found that the mean number of cigarettes they smoked per day was 28. The sample standard deviation was 2.9. At a 0.01, is there enough evidence to support her claim? Assume that the population is approximately normally distributed. Use the critical value method and tables. Part: 0/5 Part 1 of 5 (a) State the hypotheses and identify the claim. μ ローロ 0arrow_forwardAccidents and Drivers' Ages For a random selection of drivers, their ages and the number of automobile accidents that they had over a 3-year period are shown. Is there a linear relationship between the variables? Use Age for the independent variable and Accidents for the dependent variable. 27 25 42 31 43 22 24 39 Age Accidents 4 3101562 Send data to Excel Part: 0/5 Part 1 of 5 (a) Draw the scatter plot for the variables. Drivers' Age and Accidents 10- Accidents 8- 7 3 2. 14 0 3 10 15 20 25 30 35 Age x Part: 1/5 Part 2 of 5 (b) Compute the value of the correlation coefficient. Round your answer to at least three decimal places. x Part: 2/5 Part 3 of 5 (c) State the hypotheses. Continue * 80 F3 a F4 # $ % G F5 < Submit Assignment 2025 McGraw Hill LLC. All Rights Reserved. Terms of Use Privacy Center 1 Accessibility F6 & ཊུ8 DII A F7 F8 F9 F10arrow_forwardFast Food A deli manager wishes to see if there is a preference for the four types of hoagies it sells. The manager selects a week at random and records the number of hoagies of each type that the store sold. At a 0.01, is there a preference in the type of hoagies sold? Use the critical value method with The Chi-Square Distribution Table. Italian 74 Steak 52 Meatball 88 Vegetable 86 Send data to Excel Part: 0/5 Part 1 of 5 (a) Identify the claim with the correct hypothesis. Ho: Customers don't show a preference in the type of hoagie ordered. (Choose one) H₁: Customers show a preference in the type of hoagie ordered. (Choose one) x G Part: 1/5 Part 2 of 5 (b) Find the critical value. Use The Chi-Square Distribution Table. Round the answer to at least three decimal places. The critical value is Part: 2/5 Part 3 of 5 (c) Compute the test statistic. Round the intermediate and final answers to at least three decimal places. 2-1 Start over Part: 3/5 Part 4 of 5 (d) Make the decision. (Choose…arrow_forward8 19 10 11 12 13 14 15 16 Physical Therapy A random sample of 10 physical therapy patients who had knee surgery shows the angle of knee bend before physical therapy and after 6 weeks of physical therapy. At a 0.10, has there been an increase in the angle range after the therapy? Assume that all variables are normally distributed; use μ, for the "before" values and "D"₁₂. Use the critical value method and tables. Patient 1 2 3 4 S 6 7 8 9 10 Degrees before 81 84 91 66 67 92 90 93 87 62 Degrees after 120 125 129 104 106 122 119 126 115 136 Send data to Excel Part: 0/5 Part 1 of 5 (a) State the hypotheses and identify the claim. Ho (Choose one) H₁: (Choose one) This hypothesis test is a (Choose one) test. 0<0 Darrow_forward8 Español 10 11 12 13 14 15 Disabling Injuries Is the type of injury related to the age of the individual at a=0.05? Type Motor vehicle Home Work Public Under 35 35 and 26 24 29 26 11 18 36 34 I over Send data to Excel Part: 0/5 Part 1 of 5 (a) State the hypotheses and identify the claim. Ho: The type of injury is (Choose one) age. (Choose one) X H₁: The type of injury is (Choose one) age. (Choose one) Part: 1/5 Part 2 of 5 (b) Find the critical value. Round the answer to at least three decimal places. Use The Chi-Square Distribution Table. Critical value- x Part: 2/5 Part 3 of 5 (c) Compute the test statistic. Round the intermediate and final answers to at least three decimal places. 7-0 x の Part: 3/5 Part 4 of 5 (d) Make the decision. (Choose one) the null hypothesis. Part: 4/5 20 F3 a F4 G Reserved. Terms of Use Submit Assignment Privacy Center | Accessibility F5 95 8 DII F6 F7 F8 F9 F10 TAarrow_forwardEspa 3 4 5 -6 7 8 9 10 11 1 Divorce Rates The number of years that first-time married couples stay together before they divorce is shown. If the sample is random and is 2.1, find the 99% confidence interval for the mean. Round your answers to one decimal place. S 3 1 4 11 8 9 3 12 6 10 5 3 2 7 9 11 6 3 5 S 7 8 9 6 4 10 6 2 Send data to Excelarrow_forward13 14 15 16 Physical Therapy A random sample of 10 physical therapy patients who had knee surgery shows the angle of knee bend before physical therapy and after 6 weeks of physical therapy. At a 0.05, has there been an increase in the angle range after Use the HD-1-2- the therapy? Assume that all variables are normally distributed; use ₁ for the "before" values and critical value method and tables. Patient I 2 3 4 5 6 7 8 9 10 Degrees before 89 63 95 74 76 67 69 78 92 68 Degrees after 102 141 118 114 122 137 121 129 116 104 Send data to Excel Part: 0/5 Part 1 of 5 (a) State the hypotheses and identify the claim. Ho (Choose one) H₁: (Choose one) This hypothesis test is a (Choose one) test. 0>0 0<0 0x0 HD ローロ G Part: 1/5 Part 2 of 5 (b) Find the critical value(s). Round the answer(s) to at least three decimal places. If there is more than one critical value, separate them with comma Critical value(s): DO × G Part: 2/5 Part 3 of 5 (c) Compute the test statistic. Round Intermediate…arrow_forwardCigarette Smoking A researcher found that a cigarette smoker smokes on average 30 cigarettes a day. She feels that this average is too low. She selected a random sample of 8 smokers and found that the mean number of cigarettes they smoked per day was 32. The sample standard deviation was 2.8. At a 0.05, is there enough evidence to support her claim? Assume that the population is approximately normally distributed. Use the critical value method and tables. Part: 0/5 Part 1 of 5 (a) State the hypotheses and identify the claim. Ho H₁ (Choose one) (Choose one) This hypothesis test is a (Choose one) test. μ ロロ 0<0 ローロ O-O G Part: 1/5 C Part 2 of 5 (b) Find the critical value(s). Round the answer to three decimal places. If there is more than one critical value, seperate them with commas. Critical value(s): x Part: 2/5 Part 3 of 5 (c) Compute the test value. Always round r score values to three decimal places. 1 80 x Part: 3/5 Part 4 of 5 (d) Make the decision. (Choose one) the null…arrow_forwardEspañ 13 14 15 16 17 18 19 20 21 Essays A professor wishes to see if two groups of students' essays differ in lengths, that is, the number of words in each essay. The professor randomly selects 12 essays from a group of students who are science majors and 10 essays from a group of humanities majors to compare. The data are shown. Find the 99% confidence interval for the difference of the means. Assume the variables are normally distributed and the variances are unequal. Round the answers to at least one decimal place. Science majors Humanities majors 2299 3140 2409 3432 2708 1698 2699 1756 2161 5000 1960 2935 3998 3352 1599 3839 3694 2319 2043 2979 2282 2758 Send data to Excel Use MI for the mean length of the science majors' essays. << 20 F3 Continue G Submit Assignment a Å DII F4 F5 F6 F7 F8 중요 F9 F10arrow_forwardTeachers' Salaries California and New York lead the list of average teachers' salaries. The California yearly average is $65,493 while teachers in New York make an annual salary of $62,773. Random samples of 45 teachers from each state yielded the following. Sample mean Population standard California New York 65,493 62,773 8142 7821 Es deviation Send data to Excel Use #1 for the average teachers' salaries in California. At a 0.01, is there a difference in means of the salaries? Part: 0/5 Part 1 of 5 (a) State the hypotheses and identify the claim. Ho (Choose one) H₁(Choose one) This hypothesis test is a (Choose one) test. 0<0 0<0 ローロ H2 Part: 1/5 Part 2 of 5 (b) Find the critical value(s). Round the answer(s) to at least two decimal places. If there is more than one critical value, separate them with commas. Critical value(s): Part: 2/5 Part 3 of 5 (c) Compute the test value. Round the answer to at least two decimal places. Part: 3/5 Part 4 of 5 X (d) Make the decision. Continue Submit…arrow_forwardarrow_back_iosSEE MORE QUESTIONSarrow_forward_iosRecommended textbooks for you
- Glencoe Algebra 1, Student Edition, 9780079039897...AlgebraISBN:9780079039897Author:CarterPublisher:McGraw HillBig Ideas Math A Bridge To Success Algebra 1: Stu...AlgebraISBN:9781680331141Author:HOUGHTON MIFFLIN HARCOURTPublisher:Houghton Mifflin HarcourtHolt Mcdougal Larson Pre-algebra: Student Edition...AlgebraISBN:9780547587776Author:HOLT MCDOUGALPublisher:HOLT MCDOUGAL
- College Algebra (MindTap Course List)AlgebraISBN:9781305652231Author:R. David Gustafson, Jeff HughesPublisher:Cengage Learning
Glencoe Algebra 1, Student Edition, 9780079039897...AlgebraISBN:9780079039897Author:CarterPublisher:McGraw HillBig Ideas Math A Bridge To Success Algebra 1: Stu...AlgebraISBN:9781680331141Author:HOUGHTON MIFFLIN HARCOURTPublisher:Houghton Mifflin HarcourtHolt Mcdougal Larson Pre-algebra: Student Edition...AlgebraISBN:9780547587776Author:HOLT MCDOUGALPublisher:HOLT MCDOUGALCollege Algebra (MindTap Course List)AlgebraISBN:9781305652231Author:R. David Gustafson, Jeff HughesPublisher:Cengage Learning
What Are Research Ethics?; Author: HighSchoolScience101;https://www.youtube.com/watch?v=nX4c3V23DZI;License: Standard YouTube License, CC-BY
What is Ethics in Research - ethics in research (research ethics); Author: Chee-Onn Leong;https://www.youtube.com/watch?v=W8Vk0sXtMGU;License: Standard YouTube License, CC-BY