
Videos
a.
Find the
Find the median of the number of items.
a.
Answer to Problem 83CE
The mean of the number of items is 9.1.
The median of the number of items is 9.
Explanation of Solution
Calculation:
Step by step procedure to obtain mean, median using MINITAB software is given as,
- Choose Stat > Basic Statistics > Display
Descriptive Statistics . - In Variables enter the column Number of Items.
- Choose option statistics, and select Mean and Median.
- Click OK.
Output using MINITAB software is given below:
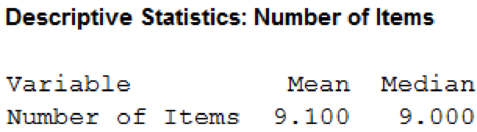
Hence, the mean of the number of items is 9.1, and the median of the number of items is 9.
b.
Find the
Find the standard deviation of the number of items.
b.
Answer to Problem 83CE
The range of the number of items is 14.
The standard deviation of the number of items is 3.566.
Explanation of Solution
Calculation:
Step by step procedure to obtain standard deviation and range using MINITAB software is given as,
- Choose Stat > Basic Statistics > Display Descriptive Statistics.
- In Variables enter the column Number of Items.
- Choose option statistics, and select standard deviation and range.
- Click OK.
Output using MINITAB software is given below:
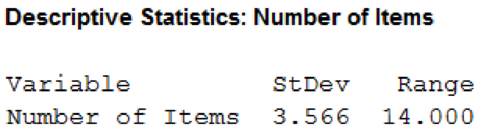
Hence, the range of the number of items is 14 and standard deviation of the number of items is 3.566.
c.
Find the frequency distribution for number of items.
c.
Answer to Problem 83CE
The frequency distribution for number of items is,
| Class | Frequency |
| 3.5-6.5 | 10 |
| 6.5-9.5 | 6 |
| 9.5-12.5 | 9 |
| 12.5-15.5 | 4 |
| 15.5-18.5 | 1 |
| Total | 30 |
Explanation of Solution
Calculation:
Selection of number of classes:
The “2 to the k rule” suggests that the number of classes is the smallest value of k, where
Formula for class interval:
The formula for the class interval is given as follows:
Frequency distribution:
The frequency table is a collection of mutually exclusive and exhaustive classes that show the number of observations in each class.
Where, i is the class interval and k is the number of classes.
The data set consists of 30 observations. The value of k can be obtained as follows:
Here,
The class interval is,
In practice, the class interval size is usually rounded up to some convenient number. Thus, the reasonable class interval is 3.
Since the minimum value is 4 and the class interval is 3, the first class would be 3.5-6.5.
The frequency distribution for duration in minutes can be constructed as follows:
| Class | Frequency |
| 3.5-6.5 | 10 |
| 6.5-9.5 | 6 |
| 9.5-12.5 | 9 |
| 12.5-15.5 | 4 |
| 15.5-18.5 | 1 |
| Total | 30 |
d.
Find the mean of the data.
Find the standard deviation of the data.
Compare these values with those computed in Part (a).
Explain why the values are different
d.
Answer to Problem 83CE
The mean of the data is 9.
The standard deviation of the data is 3.553.
Explanation of Solution
Arithmetic mean of grouped data:
The mean of the data that is given in frequency distribution (grouped data) is calculated as,
In the formula,
Midpoint:
The midpoint is the average of the lower class limits of two consecutive classes. The formula is,
The frequency distribution table for mean is,
| Class |
Frequency f | M | |
| 3.5-6.5 | 10 | 5 | 50 |
| 6.5-9.5 | 6 | 8 | 48 |
| 9.5-12.5 | 9 | 11 | 99 |
| 12.5-15.5 | 4 | 14 | 56 |
| 15.5-18.5 | 1 | 17 | 17 |
Substitute
Hence, the mean of the data is 9.
Standard deviation of grouped data:
The standard deviation of the data that is given in frequency distribution (grouped data) is calculated as,
In the formula, s denotes the sample standard deviation,
The value of mean is 9. The frequency distribution table for standard deviation is,
| Class |
Frequency f | M | |||
| 3.5-6.5 | 10 | 5 | –4 | 16 | 160 |
| 6.5-9.5 | 6 | 8 | –1 | 1 | 6 |
| 9.5-12.5 | 9 | 11 | 2 | 4 | 36 |
| 12.5-15.5 | 4 | 14 | 5 | 25 | 100 |
| 15.5-18.5 | 1 | 17 | 8 | 64 | 64 |
Substitute
Hence, the standard deviation of the data is 3.553.
The mean value is same for normal method and frequency distribution. But there is a slight change in the value of the standard deviation. This difference is due to using grouped data in frequency distribution. The frequency distribution only gives the estimate of the standard deviation because actual values of the data are not used.
Want to see more full solutions like this?
Chapter 3 Solutions
EBK STATISTICAL TECHNIQUES IN BUSINESS


 Glencoe Algebra 1, Student Edition, 9780079039897...AlgebraISBN:9780079039897Author:CarterPublisher:McGraw Hill