Elementary Statistics: A Step By Step Approach
9th Edition
ISBN: 9780073534985
Author: Allan Bluman
Publisher: McGraw-Hill Science/Engineering/Math
bartleby

Concept explainers

bartleby

Videos

Textbook Question
Book Icon
Chapter 3.1, Problem 1AC

Teacher Salaries

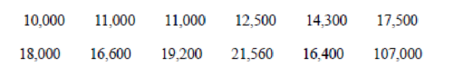
The following data from several years ago represent salaries (in dollars) from a school district in Greenwood, South Carolina.

Chapter 3.1, Problem 1AC, Teacher Salaries The following data from several years ago represent salaries (in dollars) from a

1. First, assume you work for the school board in Greenwood and do not wish to raise taxes to increase salaries. Compute the mean, median, and mode, and decide which one would best support your position to not raise salaries.

2. Second, assume you work for the teachers’ union and want a raise for the teachers. Use the best measure of central tendency to support your position.

3. Explain how outliers can be used to support one or the other position.

4. If the salaries represented every teacher in the school district, would the averages be parameters or statistics?

5. Which measure of central tendency can be misleading when a data set contains outliers?

6. When you are comparing the measures of central tendency, does the distribution display any skewness? Explain.

(1)

Expert Solution
Check Mark
To determine

The mean, median, and mode for the data of teacher’s salary and best option to support not to raise salary.

Answer to Problem 1AC

The mean for the data of teacher’s salary is 22,912.7, median is 16,650 and mode is 11,000 and to support the position of not increasing the salary, mean will be best.

Explanation of Solution

Given info:

The data for salaries (in dollars) from a school in Greenwood is,

10000 11000 11000 12,500 14,300 17,500
18,000 16,600 19,200 21,560 16,400 107,000

Calculation:

The formula to calculate the mean is,

X¯=1nXnn=X1+X2+X3+...+Xnn (1)

Where,

  • X is the number of observers and active watchers.
  • n is the total number of states.

The sum of the salaries is given below:

112X={10000+11000+11000+12,500+14,300+17,500+18,000+16,600+19,200+21,560+16,400+107,000}=275,060

Substitute 275,060 for 1nXn and 12 for n in equation (1).

X¯=275,06012=22,921.7

The mean for the data of salaries of teachers is $22,921.7.

Median:

Formula to calculate median when the number of terms is even,

Median=(n2)thvalue+(n2+1)thvalue2

Substitute 12 for n in the above formula.

Median=(122)thvalue+(122+1)thvalue2=(6)thvalue+(7)thvalue2=  16,400+16,6002=16,650

The median for the data of salaries of teachers is $16,500.

Mode:

Mode is the value that occurs most often in the given data. In the given data of salaries of teachers, the value 11,000 occurs twice, which is more frequent than any other data.

The mode for the data of salaries of teachers is $11,000.

Best measure:

The objective is not to increase salary and out of all the measure central tendencies, mode has the lowest value of 11,000 and mean has the highest value 22,912.7.

To support the decision of not increasing salary, the central tendency with highest

value will be preferable.

Thus, the mean for the data of teacher’s salary is $22,912.7, median is $17,750 and mode is 1$1,000 and to support the position of not increasing the salary, mean will be best.

(2)

Expert Solution
Check Mark
To determine

The best central tendency to support the raise in salary.

Answer to Problem 1AC

The best central tendency to support the raise in salary is Mode.

Explanation of Solution

From part (1), the mean for the data of teacher’s salary is $22,912.7, median is $17,750 and mode is $11,000.

To support the demand to raise the salary, the central tendency with highest value must be chosen.

One could say that the mode of the salaries of teachers is only $11,000.

Thus, the best central tendency to support the raise in salary is Mode.

(3)

Expert Solution
Check Mark
To determine

The role of outliers in supporting the data differently.

Answer to Problem 1AC

The outliners highly affect the mean and it causes the misleading outcomes of the study.

Explanation of Solution

The outlier is an observation point that is distant from the other observations.

These observations greatly affect the mean as mean is average of all the observations. So if a value is very large as compared to other values, the mean will be very large as compared to central value median or mode.

In this case, the value $107,000 increases the average salary to $22,912, which is far from the typical teacher’s average salary.

(4)

Expert Solution
Check Mark
To determine

Whether the averages be parameters or statistics.

Answer to Problem 1AC

The averages would be parameters as the salary of all the teachers is known.

Explanation of Solution

The salary of all the teachers is known, which means the data for entire population is available. There is no assuming or prediction of data.

If salaries represented every teacher in the school, the averages would be parameters, since the data from all the population is known.

(5)

Expert Solution
Check Mark
To determine

The central tendency that is misleading due to outliers.

Answer to Problem 1AC

The central tendency that is misleading due to outliners is mean.

Explanation of Solution

The outlier is an observation point that is distant from the other observations.

If a value is very large as compared to other values, the mean will be very large as compared to central value median or mode as mean considers all the observations.

Thus, the central tendency that is misleading due to outliners is mean.

(6)

Expert Solution
Check Mark
To determine

Whether the distribution show any skewness or not.

Answer to Problem 1AC

The distribution is positively skewed.

Explanation of Solution

The data contains observation 107,000, which is highest and very distant from the other observations.

It affects the mean and makes the mean higher than median and mode.

So, the distribution is skewed to the right.

Thus, the distribution is positively skewed.

Want to see more full solutions like this?

Subscribe now to access step-by-step solutions to millions of textbook problems written by subject matter experts!

Chapter 3 Solutions

Elementary Statistics: A Step By Step Approach

Ch. 3.1 - Foreign Workers The number of foreign workers...Ch. 3.1 - Distances of Stars Of the 25 brightest stars, the...Ch. 3.1 - Contest Spelling Words The last words given and...Ch. 3.1 - Prob. 13ECh. 3.1 - Hourly Compensation for Production Workers The...Ch. 3.1 - Prob. 15ECh. 3.1 - Percentage of Foreign-Born People The percentage...Ch. 3.1 - Percentage of College-Educated Population over 25...Ch. 3.1 - Net Worth of Corporations These data represent the...Ch. 3.1 - Specialty Coffee Shops A random sample of 30...Ch. 3.1 - Commissions Earned This frequency distribution...Ch. 3.1 - Prob. 21ECh. 3.1 - Enrollments for Selected Independent Religiously...Ch. 3.1 - Automobile Selling Prices Find the weighted mean...Ch. 3.1 - Fat Grams Using the weighted mean, find the...Ch. 3.1 - Diet Cola Preference A recent survey of a new diet...Ch. 3.1 - Costs of Helicopters The costs of three models of...Ch. 3.1 - Final Grade An instructor grades exams, 20%; term...Ch. 3.1 - Final Grade Another instructor gives four 1-hour...Ch. 3.1 - For these situations, state which measure of...Ch. 3.1 - Describe which measure of central tendencymean,...Ch. 3.1 - What types of symbols are used to represent sample...Ch. 3.1 - A local fast-food company claims that the average...Ch. 3.1 - If the mean of five values is 64, find the sum of...Ch. 3.1 - If the mean of five values is 8.2 and four of the...Ch. 3.1 - Find the mean of 10, 20, 30, 40, and 50. a. Add 10...Ch. 3.1 - Harmonic Mean The harmonic mean (HM) is defined as...Ch. 3.1 - Geometric Mean The geometric mean (GM) is defined...Ch. 3.1 - Quadratic Mean A useful mean in the physical...Ch. 3.1 - Median for Grouped Data An approximate median can...Ch. 3.2 - Blood Pressure The table lists means and standard...Ch. 3.2 - What is the relationship between the variance and...Ch. 3.2 - Why might the range not be the best estimate of...Ch. 3.2 - What are the symbols used to represent the...Ch. 3.2 - What are the symbols used to represent the sample...Ch. 3.2 - Why is the unbiased estimator of variance used?Ch. 3.2 - The three data sets have the same mean and range,...Ch. 3.2 - Prob. 7ECh. 3.2 - Cigarette Taxes The increases (in cents) in...Ch. 3.2 - Prob. 9ECh. 3.2 - Size of U.S. States The total surface area (in...Ch. 3.2 - Multiple Births The numbers of various multiple...Ch. 3.2 - Starting Teachers Salaries Starting teachers...Ch. 3.2 - Ages of U.S. Astronaut Candidates The average age...Ch. 3.2 - Times Spent in Rush-Hour Traffic A sample of 12...Ch. 3.2 - Prob. 15ECh. 3.2 - Passenger Vehicle Deaths The number of people...Ch. 3.2 - Annual Precipitation Days The number of annual...Ch. 3.2 - Use the data from Exercises 7, 15, and 17...Ch. 3.2 - Prob. 19ECh. 3.2 - Automotive Fuel Efficiency Thirty automobiles were...Ch. 3.2 - Murders in Cities The data show the number of...Ch. 3.2 - Reaction Times In a study of reaction times to a...Ch. 3.2 - FM Radio Stations A random sample of 30 states...Ch. 3.2 - Murder Rates The data represent the murder rate...Ch. 3.2 - Prob. 25ECh. 3.2 - Prob. 26ECh. 3.2 - Missing Work The average number of days that...Ch. 3.2 - Suspension Bridges The lengths (in feet) of the...Ch. 3.2 - Hospital Emergency Waiting Times The mean of the...Ch. 3.2 - Ages of Accountants The average age of the...Ch. 3.2 - Using Chebyshevs theorem, solve these problems for...Ch. 3.2 - The mean of a distribution is 20 and the standard...Ch. 3.2 - In a distribution of 160 values with a mean of 72,...Ch. 3.2 - Calories in Bagels The average number of calories...Ch. 3.2 - Time Spent Online Americans spend an average of 3...Ch. 3.2 - Solid Waste Production The average college student...Ch. 3.2 - Sale Price of Homes The average sale price of...Ch. 3.2 - Trials to Learn a Maze The average of the number...Ch. 3.2 - Farm Sizes The average farm in the United States...Ch. 3.2 - Citrus Fruit Consumption The average U.S. yearly...Ch. 3.2 - SAT Scores The national average for mathematics...Ch. 3.2 - Work Hours for College Faculty The average...Ch. 3.2 - Serum Cholesterol Levels For this data set, find...Ch. 3.2 - Ages of Consumers For this data set, find the mean...Ch. 3.2 - Prob. 45ECCh. 3.2 - Use this data set: 10, 20, 30, 40, 50 a. Find the...Ch. 3.2 - Mean Deviation The mean deviation is found by...Ch. 3.2 - All values of a data set must be within sn1 of the...Ch. 3.2 - Pearson Coefficient of Skewness A measure to...Ch. 3.3 - Determining Dosages In an attempt to determine...Ch. 3.3 - What is a z score?Ch. 3.3 - Define percentile rank.Ch. 3.3 - What is the difference between a percentage and a...Ch. 3.3 - Define quartile.Ch. 3.3 - What is the relationship between quartiles and...Ch. 3.3 - What is a decile?Ch. 3.3 - How are deciles related to percentiles?Ch. 3.3 - To which percentile, quartile, and decile does the...Ch. 3.3 - Vacation Days If the average number of vacation...Ch. 3.3 - Age of Senators The average age of Senators in the...Ch. 3.3 - Prob. 11ECh. 3.3 - Teachers Salary The average teachers salary in a...Ch. 3.3 - Prob. 13ECh. 3.3 - College and University Debt A student graduated...Ch. 3.3 - Annual Miles Driven The average miles driven...Ch. 3.3 - Which score indicates the highest relative...Ch. 3.3 - College Room and Board Costs Room and board costs...Ch. 3.3 - Prob. 19ECh. 3.3 - Airplane Speeds The airborne speeds in miles per...Ch. 3.3 - Average Weekly Earnings The average weekly...Ch. 3.3 - Test Scores Find the percentile rank for each test...Ch. 3.3 - Hurricane Damage Find the percentile rank for each...Ch. 3.3 - Test Scores Find the percentile rank for each test...Ch. 3.3 - Prob. 25ECh. 3.3 - Prob. 26ECh. 3.3 - Prob. 27ECh. 3.3 - Police Calls in Schools The number of incidents in...Ch. 3.3 - Prob. 29ECh. 3.3 - Check each data set for outliers. a. 88, 72, 97,...Ch. 3.3 - Another measure of the average is called the...Ch. 3.3 - An employment evaluation exam has a variance of...Ch. 3.3 - A particular standardized test has scores that...Ch. 3.4 - Applying the Concepts 34 The Noisy Workplace...Ch. 3.4 - For Exercises 16, identify the five-number summary...Ch. 3.4 - For Exercises 16, identify the five-number summary...Ch. 3.4 - For Exercises 16, identify the five-number summary...Ch. 3.4 - For Exercises 16, identify the five-number summary...Ch. 3.4 - For Exercises 16, identify the five-number summary...Ch. 3.4 - For Exercises 16, identify the five-number summary...Ch. 3.4 - For Exercises 710, use each boxplot to identify...Ch. 3.4 - For Exercises 710, use each boxplot to identify...Ch. 3.4 - For Exercises 710, use each boxplot to identify...Ch. 3.4 - For Exercises 7-10. use each boxplot to identify-...Ch. 3.4 - Prob. 11ECh. 3.4 - Prob. 12ECh. 3.4 - Prob. 13ECh. 3.4 - Visitors Who Travel to Foreign Countries Construct...Ch. 3.4 - Prob. 15ECh. 3.4 - Size of Dams These data represent the volumes in...Ch. 3.4 - Prob. 17ECh. 3.4 - Prob. 18ECh. 3.4 - Unhealthy Smog Days A modified boxplot can be...Ch. 3 - Prob. 3.1.1RECh. 3 - Shark Attacks The number of shark attacks and...Ch. 3 - Prob. 3.1.3RECh. 3 - SAT Scores The mean SAT math scores for selected...Ch. 3 - Households of Four Television Networks A survey...Ch. 3 - Investment Earnings An investor calculated these...Ch. 3 - Prob. 3.2.7RECh. 3 - Tallest Buildings The number of stories in the 13...Ch. 3 - Rise in Tides Shown here is a frequency...Ch. 3 - Fuel Capacity The fuel capacity in gallons for...Ch. 3 - If the range of a data set is 24, find the...Ch. 3 - If the range of a data set is 56, find the...Ch. 3 - Textbooks in Professors Offices If the average...Ch. 3 - Magazines in Bookstores A survey of bookstores...Ch. 3 - Cost of Car Rentals A survey of car rental...Ch. 3 - AID: 1825 | 28/05/2018 16. Average Earnings of...Ch. 3 - Labor Charges The average labor charge for...Ch. 3 - Costs to Train Employees For a certain type of...Ch. 3 - Prob. 3.2.19RECh. 3 - Exam Completion Time The mean time it takes a...Ch. 3 - Prob. 3.2.21RECh. 3 - Exam Grades Which of these exam grades has a...Ch. 3 - Prob. 3.3.23RECh. 3 - Printer Repairs The frequency distribution shows...Ch. 3 - Check each data set for outliers. a. 506, 511,...Ch. 3 - Check each data set for outliers. a. 14, 18, 27,...Ch. 3 - Named Storms The data show the number of named...Ch. 3 - Hours Worked The data shown here represent the...Ch. 3 - From the Data Bank, choose one of the following...Ch. 3 - Prob. 2DACh. 3 - Prob. 3DACh. 3 - Randomly select 10 values from the number of...Ch. 3 - Prob. 5DACh. 3 - AID: 1825 | 28/05/2018 Determine whether each...Ch. 3 - Prob. 2CQCh. 3 - Determine whether each statement is true or false....Ch. 3 - Prob. 4CQCh. 3 - In a data set, the mode will always be unique.Ch. 3 - Prob. 6CQCh. 3 - Determine whether each statement is true or false....Ch. 3 - Prob. 8CQCh. 3 - Determine whether each statement is true or false....Ch. 3 - Prob. 10CQCh. 3 - Prob. 11CQCh. 3 - Prob. 12CQCh. 3 - Which is not part of the five-number summary? a....Ch. 3 - A statistic that tells the number of standard...Ch. 3 - When a distribution is bell-shaped, approximately...Ch. 3 - Prob. 16CQCh. 3 - Generally, Greek letters are used to represent...Ch. 3 - Prob. 18CQCh. 3 - The symbol for the population standard deviation...Ch. 3 - When the sum of the lowest data value and the...Ch. 3 - If the mode is to the left of the median and the...Ch. 3 - An extremely high or extremely low data value is...Ch. 3 - Prob. 23CQCh. 3 - Prob. 24CQCh. 3 - Employee Years of Service In an advertisement, a...Ch. 3 - Newspapers for Sale The average number of...Ch. 3 - Prob. 27CQCh. 3 - Hours Worked The data shown here represent the...Ch. 3 - Prob. 29CQCh. 3 - Prob. 30CQCh. 3 - Exam Scores On a philosophy comprehensive exam,...Ch. 3 - Prob. 32CQCh. 3 - Prob. 1CTCCh. 3 - Ages of U.S. Residents The table shows the median...

Additional Math Textbook Solutions

Find more solutions based on key concepts
Knowledge Booster
Background pattern image
Statistics
Learn more about
Need a deep-dive on the concept behind this application? Look no further. Learn more about this topic, statistics and related others by exploring similar questions and additional content below.
Recommended textbooks for you
Text book image
Glencoe Algebra 1, Student Edition, 9780079039897...
Algebra
ISBN:9780079039897
Author:Carter
Publisher:McGraw Hill
Text book image
PREALGEBRA
Algebra
ISBN:9781938168994
Author:OpenStax
Publisher:OpenStax
The Shape of Data: Distributions: Crash Course Statistics #7; Author: CrashCourse;https://www.youtube.com/watch?v=bPFNxD3Yg6U;License: Standard YouTube License, CC-BY
Shape, Center, and Spread - Module 20.2 (Part 1); Author: Mrmathblog;https://www.youtube.com/watch?v=COaid7O_Gag;License: Standard YouTube License, CC-BY
Shape, Center and Spread; Author: Emily Murdock;https://www.youtube.com/watch?v=_YyW0DSCzpM;License: Standard Youtube License