Numerical Methods for Engineers
7th Edition
ISBN: 9780077492168
Author: Chapra
Publisher: MCG
bartleby

Videos

Textbook Question
Book Icon
Chapter 31, Problem 1P

Repeat Example 31.1, but for T ( 0 , t ) = 75  and  T ( 10 , t ) = 150 and a uniform heat source of 15.

Expert Solution & Answer
Check Mark
To determine

To calculate: The solution to the Poisson’s equation d2Tdx2=f(x) for the boundary condition T(0,t)=75 and T(10,t)=150.

Answer to Problem 1P

Solution: Solution to the Poisson’s equation for provided boundary equation is T=7.5x2+82.5x+75.

Explanation of Solution

Given Information:

Poisson’s equation:

d2Tdx2=f(x)

Here, function f(x) is the heat source along the rod.

Boundary conditions are as T(0,t)=75 and T(10,t)=150

The value of the uniform heat source is 15.

Formula used:

If a differential is in the form d2Tdx2=f(x), then the general equation to the differential equation is T=ax2+bx+c.

Calculation:

Consider the problem statement, the expression for the boundary condition is:

d2Tdx2=15

The Boundary condition is provided as follows:

T(0,t)=75 and T(10,t)=150

The general solution to the differential equation is:

T=ax2+bx+c

Differentiate it with respect to x.

dTdx=2ax+bd2Tdx2=2a

Compares the equations with each other.

2a=15a=152=7.5

Apply the boundary condition T(0,t) also substitute 7.5 for a.

75=7.5(0)2+b(0)+cc=75

Apply the boundary condition T(0,t) also substitute 7.5 for a, and 75 for c.

150=7.5(10)2+b(10)+75150+75075=10bb=82510=82.5

Substitute 7.5 for a, 82.5 for b and 75 for c.

T=7.5x2+82.5x+75

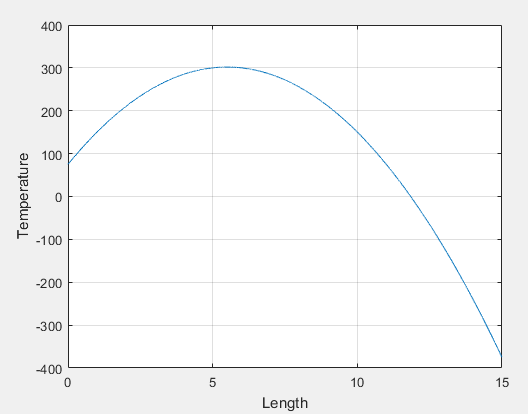
Use the following MATLAB command to execute the code and plot the temperature as a function of position along the rod.

x=0:0.001:15;

%define the range of the length

y = -7.5*x.^2+82.5*x+75;

%define the function in form of matlab code

plot(x, y)

%write the varibale into plot command in the same sequence you want to plot

xlabel('Length')

%Label axes

ylabel('Temperature')

Now, execute the program by pressing run button. Following plot is obtained that shows the plot of temperature verses distance.

Numerical Methods for Engineers, Chapter 31, Problem 1P

Want to see more full solutions like this?

Subscribe now to access step-by-step solutions to millions of textbook problems written by subject matter experts!
Knowledge Booster
Background pattern image
Advanced Math
Learn more about
Need a deep-dive on the concept behind this application? Look no further. Learn more about this topic, advanced-math and related others by exploring similar questions and additional content below.
Recommended textbooks for you
Text book image
Trigonometry (MindTap Course List)
Trigonometry
ISBN:9781337278461
Author:Ron Larson
Publisher:Cengage Learning
Text book image
Algebra & Trigonometry with Analytic Geometry
Algebra
ISBN:9781133382119
Author:Swokowski
Publisher:Cengage
2.1 Introduction to inequalities; Author: Oli Notes;https://www.youtube.com/watch?v=D6erN5YTlXE;License: Standard YouTube License, CC-BY
GCSE Maths - What are Inequalities? (Inequalities Part 1) #56; Author: Cognito;https://www.youtube.com/watch?v=e_tY6X5PwWw;License: Standard YouTube License, CC-BY
Introduction to Inequalities | Inequality Symbols | Testing Solutions for Inequalities; Author: Scam Squad Math;https://www.youtube.com/watch?v=paZSN7sV1R8;License: Standard YouTube License, CC-BY