NUMERICAL METH. F/ENGR.(LL)--W/ACCESS
7th Edition
ISBN: 9781260514131
Author: Chapra
Publisher: MCG
bartleby

Videos

Textbook Question
Book Icon
Chapter 31, Problem 1P

Repeat Example 31.1, but for T ( 0 , t ) = 75  and  T ( 10 , t ) = 150 and a uniform heat source of 15.

Expert Solution & Answer
Check Mark
To determine

To calculate: The solution to the Poisson’s equation d2Tdx2=f(x) for the boundary condition T(0,t)=75 and T(10,t)=150.

Answer to Problem 1P

Solution: Solution to the Poisson’s equation for provided boundary equation is T=7.5x2+82.5x+75.

Explanation of Solution

Given Information:

Poisson’s equation:

d2Tdx2=f(x)

Here, function f(x) is the heat source along the rod.

Boundary conditions are as T(0,t)=75 and T(10,t)=150

The value of the uniform heat source is 15.

Formula used:

If a differential is in the form d2Tdx2=f(x), then the general equation to the differential equation is T=ax2+bx+c.

Calculation:

Consider the problem statement, the expression for the boundary condition is:

d2Tdx2=15

The Boundary condition is provided as follows:

T(0,t)=75 and T(10,t)=150

The general solution to the differential equation is:

T=ax2+bx+c

Differentiate it with respect to x.

dTdx=2ax+bd2Tdx2=2a

Compares the equations with each other.

2a=15a=152=7.5

Apply the boundary condition T(0,t) also substitute 7.5 for a.

75=7.5(0)2+b(0)+cc=75

Apply the boundary condition T(0,t) also substitute 7.5 for a, and 75 for c.

150=7.5(10)2+b(10)+75150+75075=10bb=82510=82.5

Substitute 7.5 for a, 82.5 for b and 75 for c.

T=7.5x2+82.5x+75

Use the following MATLAB command to execute the code and plot the temperature as a function of position along the rod.

x=0:0.001:15;

%define the range of the length

y = -7.5*x.^2+82.5*x+75;

%define the function in form of matlab code

plot(x, y)

%write the varibale into plot command in the same sequence you want to plot

xlabel('Length')

%Label axes

ylabel('Temperature')

Now, execute the program by pressing run button. Following plot is obtained that shows the plot of temperature verses distance.
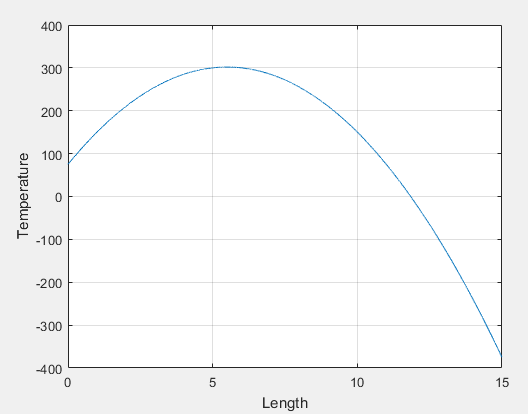
NUMERICAL METH. F/ENGR.(LL)--W/ACCESS, Chapter 31, Problem 1P

Want to see more full solutions like this?

Subscribe now to access step-by-step solutions to millions of textbook problems written by subject matter experts!
Knowledge Booster
Background pattern image
Advanced Math
Learn more about
Need a deep-dive on the concept behind this application? Look no further. Learn more about this topic, advanced-math and related others by exploring similar questions and additional content below.
Recommended textbooks for you
Text book image
Trigonometry (MindTap Course List)
Trigonometry
ISBN:9781337278461
Author:Ron Larson
Publisher:Cengage Learning
Text book image
Algebra & Trigonometry with Analytic Geometry
Algebra
ISBN:9781133382119
Author:Swokowski
Publisher:Cengage
2.1 Introduction to inequalities; Author: Oli Notes;https://www.youtube.com/watch?v=D6erN5YTlXE;License: Standard YouTube License, CC-BY
GCSE Maths - What are Inequalities? (Inequalities Part 1) #56; Author: Cognito;https://www.youtube.com/watch?v=e_tY6X5PwWw;License: Standard YouTube License, CC-BY
Introduction to Inequalities | Inequality Symbols | Testing Solutions for Inequalities; Author: Scam Squad Math;https://www.youtube.com/watch?v=paZSN7sV1R8;License: Standard YouTube License, CC-BY