
Foundations of Economics (8th Edition)
8th Edition
ISBN: 9780134486819
Author: Robin Bade, Michael Parkin
Publisher: PEARSON
expand_more
expand_more
format_list_bulleted
Question
Chapter 31, Problem 1SPPA
To determine
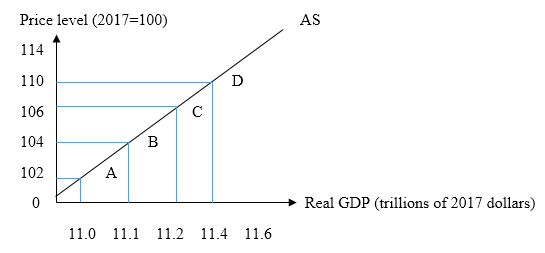
To plot:
The
Expert Solution & Answer
Explanation of Solution
Aggregate suppply curve;
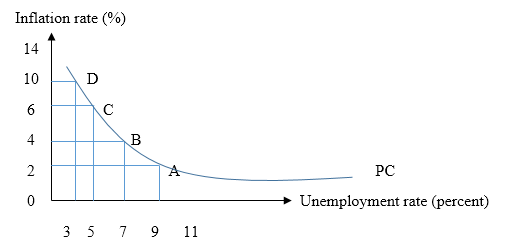
Phillips curve;
Economics Concept Introduction
Philips curve:
The Phillips curve is an economic concept which states a significant opposite relationship between inflation and
Want to see more full solutions like this?
Subscribe now to access step-by-step solutions to millions of textbook problems written by subject matter experts!
Students have asked these similar questions
The Economy in 2008In the first half of June 2008 the effects of a housing and financial crisis and an increase in world prices of oil and foodstuffs were affecting the economy.
Refer to The Economy in 2008. The short-run effects of rising world commodity prices are shown by
a.
moving to the right along the short-run Phillips curve.
b.
shifting the short-run Phillips curve right.
c.
moving to the left along the short-run Phillips curve.
d.
shifting the short-run Phillips curve left.
Which of the following is vertical?
a.
neither the long-run Phillips curve nor the long-run aggregate supply curve
b.
both the long-run Phillips curve and the long-run aggregate supply curve
c.
the long-run Phillips curve, but not the long-run aggregate supply curve
d.
the long-run Phillips curve, but not the long-run aggregate supply curve
The Phillips curve in Lowland takes the form of π = 0.04 – 0.5 (u – 0.05), where π is the actual inflation rate and u is the unemployment rate. The Phillips curve in Highland takes the form of π = 0.08 – 0.5 (u – 0.05). The current unemployment rate in both countries is 9 percent (0.09).
Explain the similarities in the Phillips curves in Highland and in Lowland.
Chapter 31 Solutions
Foundations of Economics (8th Edition)
Ch. 31 - Prob. 1SPPACh. 31 - Prob. 2SPPACh. 31 - Prob. 3SPPACh. 31 - Prob. 4SPPACh. 31 - Prob. 5SPPACh. 31 - Prob. 6SPPACh. 31 - Prob. 7SPPACh. 31 - Prob. 8SPPACh. 31 - Prob. 9SPPACh. 31 - Prob. 10SPPA
Ch. 31 - Prob. 11SPPACh. 31 - Prob. 1IAPACh. 31 - Prob. 2IAPACh. 31 - Prob. 3IAPACh. 31 - Prob. 4IAPACh. 31 - Prob. 5IAPACh. 31 - Prob. 6IAPACh. 31 - Prob. 7IAPACh. 31 - Prob. 8IAPACh. 31 - Prob. 9IAPACh. 31 - Prob. 10IAPACh. 31 - Prob. 1MCQCh. 31 - Prob. 2MCQCh. 31 - Prob. 3MCQCh. 31 - Prob. 4MCQCh. 31 - Prob. 5MCQCh. 31 - Prob. 6MCQ
Knowledge Booster

Similar questions
- An increase in worker productivity brought about by the introduction of new technology into the workplace willa. shift the long-run Phillips curve to the left.b. shift the long-run Phillips curve to the right.c. decrease aggregate demand, since workers will lose their jobs.d. cause the aggregate demand curve to become horizontal. Give proper explanations for the correct onearrow_forwardThe Phillips curve in Lowland takes the form of π = 0.04 – 0.5 (u – 0.05), where π is the actual inflation rate and u is the unemployment rate. The Phillips curve in Highland takes the form of π = 0.08 – 0.5 (u – 0.05). The current unemployment rate in both countries is 9 percent (0.09). Explain the difference in the Phillips curves in Highland and in Lowland.arrow_forwardThe Phillips curve represents the relationship between unemployment and inflation. You are required to think about the impact on the economy of movements along the curve. If the unemployment rate in the economy is steady at 4 percent per year, how does the short-run Phillips curve predict that the inflation rate will be changing, if at all? What will happen if the unemployment rate now rises to 7 percent per year? Assume there are no changes to inflation expectations. Provide an appropriate graph to support your discussion.arrow_forward
- A worldwide drought has reduced food production. Inflation has increased, unemployment has risen above the natural rate, Pakistani’s are frustrated with their government. Your roommate says, "This economic mess has got to be somebody's fault—probably the Prime Minister or National Assembly. A year ago, both inflation and unemployment were lower. We need to vote in some policymakers that know how to get rid of this inflation and unemployment." a. If policymakers increase aggregate demand in response to the supply shock, in what direction will the economy move along the new short-run Phillips curve? What will happen to inflation and unemployment? b. Is there a policy that can immediately reduce both inflation and unemployment? Explain.arrow_forwardfavourable shock to aggregate supply, use the model of aggregate demand and aggregate supply to explain the effects of such a shock , how does it effect the phillips curve?arrow_forwardPart a.: The Phillips curve slopes (downward/upward), since a more positive output gap is associated with a (higher/lower) level of unexpected inflation. The labor market Phillips Curve slopes (downward/upward), since a more positive output gap is associated with a (higher/lower) level of unemployment. Note:- Do not provide handwritten solution. Maintain accuracy and quality in your answer. Take care of plagiarism. Answer completely. You will get up vote for sure.arrow_forward
- Go to the website of Statistics Canada www statcan ca For each Go to the website of Statistics Canada (www.statcan.ca). For each of the past five years, find the inflation rate as measured by the consumer price index (all items)—sometimes called head-line inflation —and as measured by the CPI excluding food and energy—sometimes called core inflation. Compare these two measures of inflation. Why might they be different? What might the difference tell you about shifts in the aggregate supply curve and in the short-run Phillips curve? Go to the website of Statistics Canada www statcan ca For eacharrow_forwardQuestion 30 The short-run Phillips curve is based on the assumption that there is_____. no relationship between the inflation and unemployment a direct relationship between the inflation and unemployment an inverse relationship between the inflation and unemployment a trade-off between the output and unemploymentarrow_forwardDraw the Phillips curve.Use the model of aggregate demand and aggregate supply to show how policy can move the economy from a point on this curve with high inflation to a point with low inflationarrow_forward
- The inflation rate is 2 percent a year, and the quantity of money is growing at a pace that will maintain that inflation rate. The natural unemployment rate is 7 percent, and the current unemployment rate is 9 percent. In what direction will the unemployment rate change? How will the short-run Phillips curve and the long-run Phillips curve shift?arrow_forwardAggregate demand, aggregate supply, and the Phillips curve In the year 2027, aggregate demand and aggregate supply in the imaginary country of Daisen-Oki are represented by the curves AD 2027 and AS on the following graph. The price level is currently 102. The graph also shows two potential outcomes for 2028. The first possible aggregate demand curve is given by the curve labeled AD(a) curve, resulting in the outcome given by point A. The second possible aggregate demand curve is given by the curve labeled AD(b), resulting in the outcome given by point B. Suppose the unemployment rate is 7% under one of these two outcomes and 6% under the other. Based on the previous graph, you would expect (OUTCOME A or OUTCOME B) to be associated with the higher unemployment rate (7%). If aggregate demand is high in 2028, and the economy is at outcome B, the inflation rate between 2027 and 2028 is (1.96% or 5.00% or 4.00% or 2.94%). Based on your answers to the previous…arrow_forwardInclude correctly labeled diagrams, if useful or required, in explaining your answers. A correctly labeled diagram must have all axes and curves clearly labeled and must show directional changes. If the question prompts you to “Calculate,” you must show how you arrived at your final answer. 1. Assume that the United States economy is currently in a recession in a short-run equilibrium. a. Draw a correctly labeled graph of the short-run and long-run Phillips curves. Use the letter A to label a point that could represent the current state of the economy in recession. b. Draw a correctly labeled graph of aggregate demand and aggregate supply in the recession and show each of the following. i)The long-run equilibrium output, labeled Yf ii) The current equilibrium output and price levels, labeled Ye and PLe, respectively C)To balance the federal budget, suppose that the government decides to raise income taxes while maintaining the current level of government spending. On the graph…arrow_forward
arrow_back_ios
SEE MORE QUESTIONS
arrow_forward_ios
Recommended textbooks for you
 Brief Principles of Macroeconomics (MindTap Cours...EconomicsISBN:9781337091985Author:N. Gregory MankiwPublisher:Cengage Learning

Brief Principles of Macroeconomics (MindTap Cours...
Economics
ISBN:9781337091985
Author:N. Gregory Mankiw
Publisher:Cengage Learning