ELEMENTARY STATISTICS W/CONNECT >IP<
4th Edition
ISBN: 9781259746826
Author: Bluman
Publisher: MCG
bartleby

Videos

Textbook Question
Book Icon
Chapter 3.1, Problem 22E

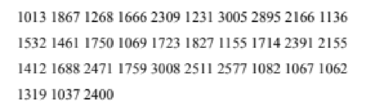
Enrollments for Selected Independent Religiously Controlled 4-Year Colleges Listed below are the enrollments for selected independent religiously controlled 4-year colleges that offer bachelor’s degrees only. Construct a grouped frequency distribution with six classes and find the mean and modal class.

Chapter 3.1, Problem 22E, Enrollments for Selected Independent Religiously Controlled 4-Year Colleges Listed below are the

Expert Solution & Answer
Check Mark
To determine

The frequency distribution for given data; the mean and modal class of the given data.

Answer to Problem 22E

The frequency distribution for given data is tabulated below:

Class interval Frequency
1000-1499 13
1500-1999 9
2000-2499 5
2500-2999 2
3000-3499 2
3500-3999 0
Total 31

The mean of the data is 1825.26. The modal class for data is 1000-1499.

Explanation of Solution

Given info:

The data shows the enrollments for selected independent religiously controlled 4-years colleges.

Use number of class 6 for given data.

Calculation:

Steps to obtain the frequency distribution of given data

Step 1: The lowest value in the data set is 1013. The highest value in the data set is 3008.

Step 2: Calculate the class width using the formula,

Class widthMaximum data valueMinimum data valuenumberofclasses

Substitute 6 for number of classes, 1013 for minimum data value and 3008 for maximum data value in the above formula.

Classwidth=300810136=29856=497.5500(rounded up to a more convenient number)

Step-3: Take a start value that is less than or equal to smallest value of data for this data take 1000 as start value.

Step 4: Add the class width of 500 to the starting value to obtain the second lower class limit is 1500. Continue to add the class width of 500 until six lower class limits are found. Thus, the lower class limits are 1000, 1500, 2000, 2500, 3000 and 3500.

Step 4: List the lower class limits vertically, to identify the corresponding upper class limits as shown in Table (1).

Class interval
1000-
1500-
2000-
2500-
3000-
3500-

Table (1)

Thus, the upper class limits are 1499, 1999, 2499, 2999, 3499-and 3999.

Step 5: Enter a tally mark for each data value in the appropriate class. Then add the tally marks to obtain the frequency for each class interval shown in Table (2).

Service times (sec) Tally mark Frequency
1000-1499 ||||||||||| 13
1500-1999 |||||||| 9
2000-2499 ||||| 6
2500-2999 ||| 3
3000-3499 || 2
3500-3999 0
Total 33

Table (2)

From the Table (2), it can be observed that the total frequency is 33 and the number of classes is 6.

The total number of frequency is,

1013,1867,1268,2309,1231,3005,2895,2166,1136,1532,1461,1750,1069,1723,1827,1155,1714,2391,2155,1412,1688,2471,1759,3008,2511,2577,1082,1067,1062,1319,1037,2400

The formula to calculate the mean is,

X¯=1nXn=X1+X2+X3+...+Xnn (1)

Where,

X is the number of enrollments in different colleges.

n is the total number of colleges.

The sum of the total enrollments is give below:

133X=[1013+1867+1268+2309+1231+3005+2895+2166+1136+1532+1461+1750+1069+1723+1827+1155+1714+2391+2155+1412+1688+2471+1759+3008+2511+2577+1082+1067+1062+1319+1037+2400]=60233.5

Substitute 133X=60233.5 and n=33 in equation (1).

Mean=60233.533=1825.26

The modal class is the class with largest frequency.

Since, the class 1000-1499 has the largest frequency. Hence, it is modal class for data. Sometimes midpoint of the class is used it is 1249.5 for this data.

Want to see more full solutions like this?

Subscribe now to access step-by-step solutions to millions of textbook problems written by subject matter experts!

Chapter 3 Solutions

ELEMENTARY STATISTICS W/CONNECT >IP<

Ch. 3.1 - Foreign Workers The number of foreign workers...Ch. 3.1 - Distances of Stars Of the 25 brightest stars, the...Ch. 3.1 - Contest Spelling Words The last words given and...Ch. 3.1 - Prob. 13ECh. 3.1 - Hourly Compensation for Production Workers The...Ch. 3.1 - Prob. 15ECh. 3.1 - Percentage of Foreign-Born People The percentage...Ch. 3.1 - Percentage of College-Educated Population over 25...Ch. 3.1 - Net Worth of Corporations These data represent the...Ch. 3.1 - Specialty Coffee Shops A random sample of 30...Ch. 3.1 - Commissions Earned This frequency distribution...Ch. 3.1 - Prob. 21ECh. 3.1 - Enrollments for Selected Independent Religiously...Ch. 3.1 - Automobile Selling Prices Find the weighted mean...Ch. 3.1 - Fat Grams Using the weighted mean, find the...Ch. 3.1 - Diet Cola Preference A recent survey of a new diet...Ch. 3.1 - Costs of Helicopters The costs of three models of...Ch. 3.1 - Final Grade An instructor grades exams, 20%; term...Ch. 3.1 - Final Grade Another instructor gives four 1-hour...Ch. 3.1 - For these situations, state which measure of...Ch. 3.1 - Describe which measure of central tendencymean,...Ch. 3.1 - What types of symbols are used to represent sample...Ch. 3.1 - A local fast-food company claims that the average...Ch. 3.1 - If the mean of five values is 64, find the sum of...Ch. 3.1 - If the mean of five values is 8.2 and four of the...Ch. 3.1 - Find the mean of 10, 20, 30, 40, and 50. a. Add 10...Ch. 3.1 - Harmonic Mean The harmonic mean (HM) is defined as...Ch. 3.1 - Geometric Mean The geometric mean (GM) is defined...Ch. 3.1 - Quadratic Mean A useful mean in the physical...Ch. 3.1 - Median for Grouped Data An approximate median can...Ch. 3.2 - Blood Pressure The table lists means and standard...Ch. 3.2 - What is the relationship between the variance and...Ch. 3.2 - Why might the range not be the best estimate of...Ch. 3.2 - What are the symbols used to represent the...Ch. 3.2 - What are the symbols used to represent the sample...Ch. 3.2 - Why is the unbiased estimator of variance used?Ch. 3.2 - The three data sets have the same mean and range,...Ch. 3.2 - Prob. 7ECh. 3.2 - Cigarette Taxes The increases (in cents) in...Ch. 3.2 - Prob. 9ECh. 3.2 - Size of U.S. States The total surface area (in...Ch. 3.2 - Multiple Births The numbers of various multiple...Ch. 3.2 - Starting Teachers Salaries Starting teachers...Ch. 3.2 - Ages of U.S. Astronaut Candidates The average age...Ch. 3.2 - Times Spent in Rush-Hour Traffic A sample of 12...Ch. 3.2 - Prob. 15ECh. 3.2 - Passenger Vehicle Deaths The number of people...Ch. 3.2 - Annual Precipitation Days The number of annual...Ch. 3.2 - Use the data from Exercises 7, 15, and 17...Ch. 3.2 - Prob. 19ECh. 3.2 - Automotive Fuel Efficiency Thirty automobiles were...Ch. 3.2 - Murders in Cities The data show the number of...Ch. 3.2 - Reaction Times In a study of reaction times to a...Ch. 3.2 - FM Radio Stations A random sample of 30 states...Ch. 3.2 - Murder Rates The data represent the murder rate...Ch. 3.2 - Prob. 25ECh. 3.2 - Prob. 26ECh. 3.2 - Missing Work The average number of days that...Ch. 3.2 - Suspension Bridges The lengths (in feet) of the...Ch. 3.2 - Hospital Emergency Waiting Times The mean of the...Ch. 3.2 - Ages of Accountants The average age of the...Ch. 3.2 - Using Chebyshevs theorem, solve these problems for...Ch. 3.2 - The mean of a distribution is 20 and the standard...Ch. 3.2 - In a distribution of 160 values with a mean of 72,...Ch. 3.2 - Calories in Bagels The average number of calories...Ch. 3.2 - Time Spent Online Americans spend an average of 3...Ch. 3.2 - Solid Waste Production The average college student...Ch. 3.2 - Sale Price of Homes The average sale price of...Ch. 3.2 - Trials to Learn a Maze The average of the number...Ch. 3.2 - Farm Sizes The average farm in the United States...Ch. 3.2 - Citrus Fruit Consumption The average U.S. yearly...Ch. 3.2 - SAT Scores The national average for mathematics...Ch. 3.2 - Work Hours for College Faculty The average...Ch. 3.2 - Serum Cholesterol Levels For this data set, find...Ch. 3.2 - Ages of Consumers For this data set, find the mean...Ch. 3.2 - Prob. 45ECCh. 3.2 - Use this data set: 10, 20, 30, 40, 50 a. Find the...Ch. 3.2 - Mean Deviation The mean deviation is found by...Ch. 3.2 - All values of a data set must be within sn1 of the...Ch. 3.2 - Pearson Coefficient of Skewness A measure to...Ch. 3.3 - Determining Dosages In an attempt to determine...Ch. 3.3 - What is a z score?Ch. 3.3 - Define percentile rank.Ch. 3.3 - What is the difference between a percentage and a...Ch. 3.3 - Define quartile.Ch. 3.3 - What is the relationship between quartiles and...Ch. 3.3 - What is a decile?Ch. 3.3 - How are deciles related to percentiles?Ch. 3.3 - To which percentile, quartile, and decile does the...Ch. 3.3 - Vacation Days If the average number of vacation...Ch. 3.3 - Age of Senators The average age of Senators in the...Ch. 3.3 - Prob. 11ECh. 3.3 - Teachers Salary The average teachers salary in a...Ch. 3.3 - Prob. 13ECh. 3.3 - College and University Debt A student graduated...Ch. 3.3 - Annual Miles Driven The average miles driven...Ch. 3.3 - Which score indicates the highest relative...Ch. 3.3 - College Room and Board Costs Room and board costs...Ch. 3.3 - Prob. 19ECh. 3.3 - Airplane Speeds The airborne speeds in miles per...Ch. 3.3 - Average Weekly Earnings The average weekly...Ch. 3.3 - Test Scores Find the percentile rank for each test...Ch. 3.3 - Hurricane Damage Find the percentile rank for each...Ch. 3.3 - Test Scores Find the percentile rank for each test...Ch. 3.3 - Prob. 25ECh. 3.3 - Prob. 26ECh. 3.3 - Prob. 27ECh. 3.3 - Police Calls in Schools The number of incidents in...Ch. 3.3 - Prob. 29ECh. 3.3 - Check each data set for outliers. a. 88, 72, 97,...Ch. 3.3 - Another measure of the average is called the...Ch. 3.3 - An employment evaluation exam has a variance of...Ch. 3.3 - A particular standardized test has scores that...Ch. 3.4 - Applying the Concepts 34 The Noisy Workplace...Ch. 3.4 - For Exercises 16, identify the five-number summary...Ch. 3.4 - For Exercises 16, identify the five-number summary...Ch. 3.4 - For Exercises 16, identify the five-number summary...Ch. 3.4 - For Exercises 16, identify the five-number summary...Ch. 3.4 - For Exercises 16, identify the five-number summary...Ch. 3.4 - For Exercises 16, identify the five-number summary...Ch. 3.4 - For Exercises 710, use each boxplot to identify...Ch. 3.4 - For Exercises 710, use each boxplot to identify...Ch. 3.4 - For Exercises 710, use each boxplot to identify...Ch. 3.4 - For Exercises 7-10. use each boxplot to identify-...Ch. 3.4 - Prob. 11ECh. 3.4 - Prob. 12ECh. 3.4 - Prob. 13ECh. 3.4 - Visitors Who Travel to Foreign Countries Construct...Ch. 3.4 - Prob. 15ECh. 3.4 - Size of Dams These data represent the volumes in...Ch. 3.4 - Prob. 17ECh. 3.4 - Prob. 18ECh. 3.4 - Unhealthy Smog Days A modified boxplot can be...Ch. 3 - Prob. 3.1.1RECh. 3 - Shark Attacks The number of shark attacks and...Ch. 3 - Prob. 3.1.3RECh. 3 - SAT Scores The mean SAT math scores for selected...Ch. 3 - Households of Four Television Networks A survey...Ch. 3 - Investment Earnings An investor calculated these...Ch. 3 - Prob. 3.2.7RECh. 3 - Tallest Buildings The number of stories in the 13...Ch. 3 - Rise in Tides Shown here is a frequency...Ch. 3 - Fuel Capacity The fuel capacity in gallons for...Ch. 3 - If the range of a data set is 24, find the...Ch. 3 - If the range of a data set is 56, find the...Ch. 3 - Textbooks in Professors Offices If the average...Ch. 3 - Magazines in Bookstores A survey of bookstores...Ch. 3 - Cost of Car Rentals A survey of car rental...Ch. 3 - AID: 1825 | 28/05/2018 16. Average Earnings of...Ch. 3 - Labor Charges The average labor charge for...Ch. 3 - Costs to Train Employees For a certain type of...Ch. 3 - Prob. 3.2.19RECh. 3 - Exam Completion Time The mean time it takes a...Ch. 3 - Prob. 3.2.21RECh. 3 - Exam Grades Which of these exam grades has a...Ch. 3 - Prob. 3.3.23RECh. 3 - Printer Repairs The frequency distribution shows...Ch. 3 - Check each data set for outliers. a. 506, 511,...Ch. 3 - Check each data set for outliers. a. 14, 18, 27,...Ch. 3 - Named Storms The data show the number of named...Ch. 3 - Hours Worked The data shown here represent the...Ch. 3 - From the Data Bank, choose one of the following...Ch. 3 - Prob. 2DACh. 3 - Prob. 3DACh. 3 - Randomly select 10 values from the number of...Ch. 3 - Prob. 5DACh. 3 - AID: 1825 | 28/05/2018 Determine whether each...Ch. 3 - Prob. 2CQCh. 3 - Determine whether each statement is true or false....Ch. 3 - Prob. 4CQCh. 3 - In a data set, the mode will always be unique.Ch. 3 - Prob. 6CQCh. 3 - Determine whether each statement is true or false....Ch. 3 - Prob. 8CQCh. 3 - Determine whether each statement is true or false....Ch. 3 - Prob. 10CQCh. 3 - Prob. 11CQCh. 3 - Prob. 12CQCh. 3 - Which is not part of the five-number summary? a....Ch. 3 - A statistic that tells the number of standard...Ch. 3 - When a distribution is bell-shaped, approximately...Ch. 3 - Prob. 16CQCh. 3 - Generally, Greek letters are used to represent...Ch. 3 - Prob. 18CQCh. 3 - The symbol for the population standard deviation...Ch. 3 - When the sum of the lowest data value and the...Ch. 3 - If the mode is to the left of the median and the...Ch. 3 - An extremely high or extremely low data value is...Ch. 3 - Prob. 23CQCh. 3 - Prob. 24CQCh. 3 - Employee Years of Service In an advertisement, a...Ch. 3 - Newspapers for Sale The average number of...Ch. 3 - Prob. 27CQCh. 3 - Hours Worked The data shown here represent the...Ch. 3 - Prob. 29CQCh. 3 - Prob. 30CQCh. 3 - Exam Scores On a philosophy comprehensive exam,...Ch. 3 - Prob. 32CQCh. 3 - Prob. 1CTCCh. 3 - Ages of U.S. Residents The table shows the median...
Knowledge Booster
Background pattern image
Statistics
Learn more about
Need a deep-dive on the concept behind this application? Look no further. Learn more about this topic, statistics and related others by exploring similar questions and additional content below.
Recommended textbooks for you
Text book image
Glencoe Algebra 1, Student Edition, 9780079039897...
Algebra
ISBN:9780079039897
Author:Carter
Publisher:McGraw Hill
How to make Frequency Distribution Table / Tally Marks and Frequency Distribution Table; Author: Reenu Math;https://www.youtube.com/watch?v=i_A6RiE8tLE;License: Standard YouTube License, CC-BY
Frequency distribution table in statistics; Author: Math and Science;https://www.youtube.com/watch?v=T7KYO76DoOE;License: Standard YouTube License, CC-BY
Frequency Distribution Table for Grouped/Continuous data | Math Dot Com; Author: Maths dotcom;https://www.youtube.com/watch?v=ErnccbXQOPY;License: Standard Youtube License