
Videos
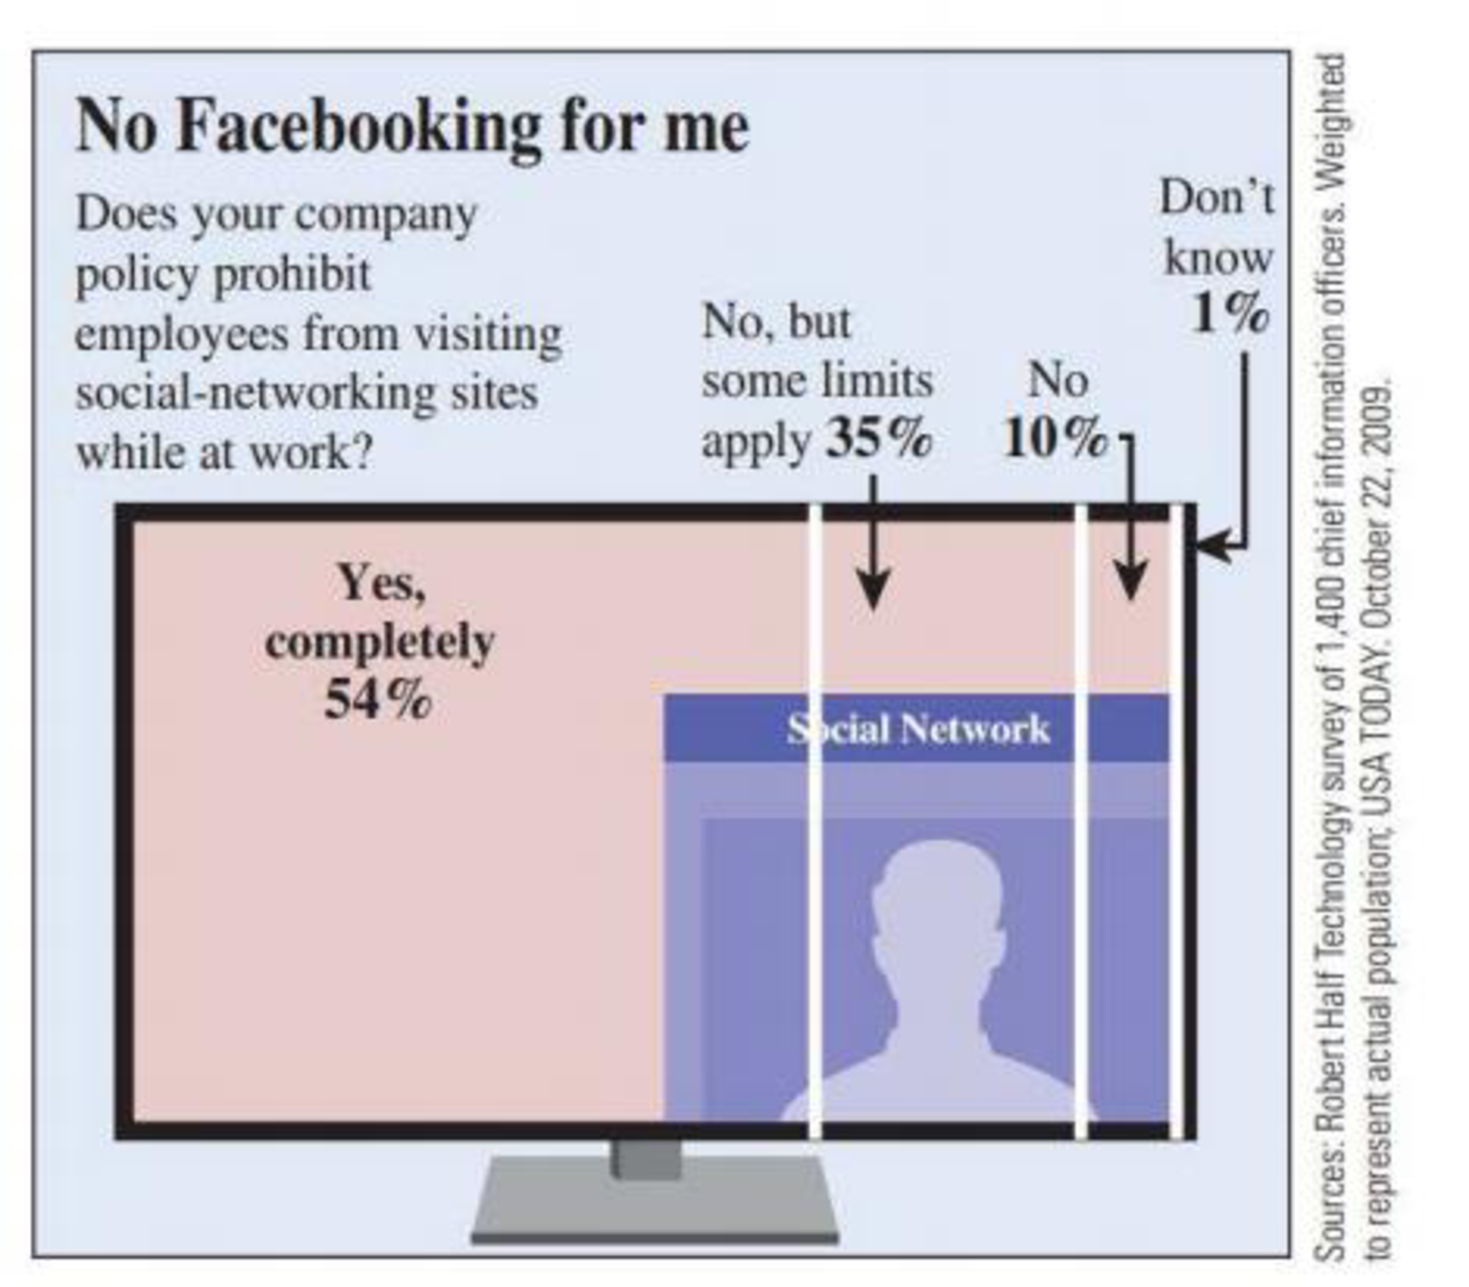
The graphical display on the next page is similar to one that appeared in USA TODAY (October 22, 2009). It summarizes survey responses to a question about whether visiting social networking sites is allowed at work. Which of the graph types introduced in this section is used to display the responses? (USA TODAY frequently adds artwork and text to their graphs to try to make them look more interesting.)

Trending nowThis is a popular solution!

Chapter 3 Solutions
Introduction To Statistics And Data Analysis
Additional Math Textbook Solutions
STATISTICS F/BUSINESS+ECONOMICS-TEXT
Elementary Statistics Using Excel (6th Edition)
Elementary Statistics Using the TI-83/84 Plus Calculator, Books a la Carte Edition (4th Edition)
Elementary Statistics Using The Ti-83/84 Plus Calculator, Books A La Carte Edition (5th Edition)
Statistics: Informed Decisions Using Data (5th Edition)
Elementary Statistics: Picturing the World (7th Edition)


 Glencoe Algebra 1, Student Edition, 9780079039897...AlgebraISBN:9780079039897Author:CarterPublisher:McGraw Hill
 Algebra & Trigonometry with Analytic GeometryAlgebraISBN:9781133382119Author:SwokowskiPublisher:Cengage
 Elementary Geometry For College Students, 7eGeometryISBN:9781337614085Author:Alexander, Daniel C.; Koeberlein, Geralyn M.Publisher:Cengage,
 College Algebra (MindTap Course List)AlgebraISBN:9781305652231Author:R. David Gustafson, Jeff HughesPublisher:Cengage Learning