Elementary Statistics: A Step By Step Approach
10th Edition
ISBN: 9781259755330
Author: Allan G. Bluman
Publisher: McGraw-Hill Education
bartleby

Concept explainers

bartleby

Videos

Textbook Question
Book Icon
Chapter 3.2, Problem 11E

Multiple Births The numbers of various multiple births in the United States for the past 10 years are listed. Find the range, variance, and standard deviation of the data sets. Which set of data is the most variable?

Chapter 3.2, Problem 11E, Multiple Births The numbers of various multiple births in the United States for the past 10 years

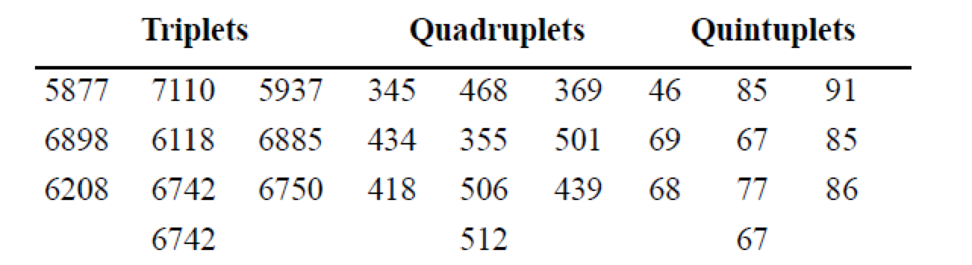
Source: World Almanac 2012.

Expert Solution & Answer
Check Mark
To determine

The range, variance and standard deviation of the given data; the set of data that is the most variable.

Answer to Problem 11E

The range of triplets birth, quadruplets birth quintuplets birth are 1,233, 167, and 45 respectively.

The variance of triplet birth, quadruplet birth, and, quintuplet birth are 291845.4, 3,268.44, and 162.69.

The standard deviation of triplets birth, quadruplets birth, and quintuplet birth are 540.22, 57.22, and 12.75.

The triplet birth data is most variable and quintuplet birth data is least variable.

Explanation of Solution

Given info:

The data for the Triplets birth are shown below,

5,877 7,110 5937
6,898 6,118 6,885
6,208 6,742 6,750
6,742

The data for the Quadruplets birth is,

345 468 369
434 355 501
418 506 439
512

The data for the quintuplets is,

46 85 91
69 67 85
68 77 86
67

Calculation:

Formula to calculate the range is,

Range=highestvaluelowestvalue

Substitute 7110 for highest value and 5877 for lowest value in the above formula to calculate the range of triplets birth.

Range=7110-5877=1233

Substitute 512 for highest value and 345 for lowest value in the above formula to calculate the range of quadruplet’s birth.

Range=512345=167

Substitute 91 for the highest value and 46 for lowest value in the above formula to calculate the range of quintuplet’s birth.

Range=91-46=45

Formula to calculate the variance is,

Variance=(Xμ)2N (1)

Where,

  • X is individual value.
  • μ is the population mean.
  • N is the population size.

Step to calculate the population variance of triplet’s birth,

Determine the mean of the data.

μ=XN (2)

Substitute the values of X in the equation (2) to get the mean of the data.

μ=5877+6898+6208+7110+6118+6742+6742+5937+6885+765010=6616710=6616.7

Subtract the mean from each data value (Xμ) .

Determine square each result (Xμ)2 .

Determine sum of squares (Xμ)2 .

Divide the sum by N to get the variance (Xμ)2N .

Table for calculating variance given below,

Values X (Xμ) (Xμ)2
5877 58776616.7=739.7 547156.1
6898 68986616.7=282.3 79129.69
6208 62086616.7=408.7 167035.7
7110 71106616.7=493.3 243344.9
6118 61186616.7=498.7 248701.7
6742 67426616.7=125.3 15700.09
6742 67426616.7=125.3 15700.09
5937 59376616.7=679.7 461992.1
6885 68856616.7=268.3 71984.89
7650 76506616.7=1033.3 1067709
TOTAL 2918454

Substitute 2918454 for (Xμ)2 and 10 for N in the equation (1) to get the population variance,

Variance=291845410=291845.4

Take the square root of the 2918454 to get the population standard deviation.

Standarddeviation=291845.4540.22

Steps to calculate the population variance of quadruplet’s birth,

Determine the mean of the data,

Substitute the value X in the equation (2) to get the mean of the data.

μ=345+434+418+468+355+506+512+396+501+43910=437410=437.4

Subtract the mean from each data value (Xμ) .

Determine square each result (Xμ)2 .

Determine sum of squares (Xμ)2 .

Divide the sum by N to get the variance (Xμ)2N .

Table for calculating variance given below,

Values X (Xμ) (Xμ)2
345 345437.4=92.4 8537.76
434 434437.4=3.4 11.56
418 418437.4=19.4 376.36
468 468437.4=30.6 936.36
355 355437.4=82.4 6789.76
506 506437.4=68.6 4705.96
512 512437.4=74.6 5565.16
396 396437.4=41.4 1713.96
501 501437.4=63.6 4044.96
439 439437.4=1.6 2.56
TOTAL 32684.4

Substitute 32684.4 for (Xμ)2 and 10 for N in equation (1) to get the population variance of the data,

Variance=32684.410=3268.44

Take the square root of the variance which is 3268.44 to get the population standard deviation of the data.

Standarddeviation=3268.4457.17

Steps to calculate the population variance of the quintuplet birth,

Determine the mean of the data

Substitute the values of the X in the equation (2) to get the mean of the quintuplet birth,

μ=46+69+68+85+67+77+67+91+85+8610=74110=74.1

Subtract the mean from each data value (Xμ) .

Determine square each result (Xμ)2 .

Determine sum of squares (Xμ)2 .

Divide the sum by N to get the variance (Xμ)2N .

Table for calculating variance given below,

Values X (Xμ) (Xμ)2
46 4674.1=28.1 789.61
69 6974.1=5.1 26.01
68 6874.1=6.1 37.21
85 8574.1=10.9 118.81
67 6774.1=7.1 50.41
77 7774.1=2.9 8.41
67 6774.1=7.1 50.41
91 9174.1=16.9 285.61
85 8574.1=10.9 118.81
86 8674.1=11.9 141.61
TOTAL 1626.9

Substitute 1626.9 for (Xμ)2 and 10 for N in the equation (1) to get the population, variance of the data.

Variance=1626.910=162.69

Take the square root of the 162.69 to get the population standard deviation for the quintuplet birth data.

Standarddeviation=162.6912.75

Thus, the population variance and population standard deviation for the quintuplets birth data is 162.69 and 12.75 respectively.

Standard deviation for triplet birth is 540.22 for quadruplets birth is 57.17 and for quintuplet birth is 12.75.

The maximum standard deviation gives more variability. So, triplet birth data is most variable and quintuplet birth data is least variable.

Want to see more full solutions like this?

Subscribe now to access step-by-step solutions to millions of textbook problems written by subject matter experts!

Chapter 3 Solutions

Elementary Statistics: A Step By Step Approach

Ch. 3.1 - Foreign Workers The number of foreign workers...Ch. 3.1 - Distances of Stars Of the 25 brightest stars, the...Ch. 3.1 - Contest Spelling Words The last words given and...Ch. 3.1 - Wind Speeds The data show the maximum wind speeds...Ch. 3.1 - Hourly Compensation for Production Workers The...Ch. 3.1 - Points in Rose Bowl Games The data show the number...Ch. 3.1 - Percentage of Foreign-Born People The percentage...Ch. 3.1 - Percentage of College-Educated Population over 25...Ch. 3.1 - Net Worth of Corporations These data represent the...Ch. 3.1 - Specialty Coffee Shops A random sample of 30...Ch. 3.1 - Commissions Earned This frequency distribution...Ch. 3.1 - Children of U.S. Presidents The data show the...Ch. 3.1 - Enrollments for Selected Independent Religiously...Ch. 3.1 - Automobile Selling Prices Find the weighted mean...Ch. 3.1 - Fat Grams Using the weighted mean, find the...Ch. 3.1 - Diet Cola Preference A recent survey of a new diet...Ch. 3.1 - Costs of Helicopters The costs of three models of...Ch. 3.1 - Final Grade An instructor grades exams, 20%; term...Ch. 3.1 - Final Grade Another instructor gives four 1-hour...Ch. 3.1 - For these situations, state which measure of...Ch. 3.1 - Describe which measure of central tendencymean,...Ch. 3.1 - What types of symbols are used to represent sample...Ch. 3.1 - A local fast-food company claims that the average...Ch. 3.1 - If the mean of five values is 64, find the sum of...Ch. 3.1 - If the mean of five values is 8.2 and four of the...Ch. 3.1 - Find the mean of 10, 20, 30, 40, and 50. a. Add 10...Ch. 3.1 - Harmonic Mean The harmonic mean (HM) is defined as...Ch. 3.1 - Geometric Mean The geometric mean (GM) is defined...Ch. 3.1 - Quadratic Mean A useful mean in the physical...Ch. 3.1 - Median for Grouped Data An approximate median can...Ch. 3.2 - Blood Pressure The table lists means and standard...Ch. 3.2 - What is the relationship between the variance and...Ch. 3.2 - Why might the range not be the best estimate of...Ch. 3.2 - What are the symbols used to represent the...Ch. 3.2 - What are the symbols used to represent the sample...Ch. 3.2 - Why is the unbiased estimator of variance used?Ch. 3.2 - The three data sets have the same mean and range,...Ch. 3.2 - Traveler Spending The data show the traveler...Ch. 3.2 - Cigarette Taxes The increases (in cents) in...Ch. 3.2 - Prob. 9ECh. 3.2 - Size of U.S. States The total surface area (in...Ch. 3.2 - Multiple Births The numbers of various multiple...Ch. 3.2 - Starting Teachers Salaries Starting teachers...Ch. 3.2 - Ages of U.S. Astronaut Candidates The average age...Ch. 3.2 - Times Spent in Rush-Hour Traffic A sample of 12...Ch. 3.2 - Laws Passed The data show the number of public...Ch. 3.2 - Passenger Vehicle Deaths The number of people...Ch. 3.2 - Annual Precipitation Days The number of annual...Ch. 3.2 - Use the data from Exercises 7, 15, and 17...Ch. 3.2 - Pupils Per Teacher The following frequency...Ch. 3.2 - Automotive Fuel Efficiency Thirty automobiles were...Ch. 3.2 - Murders in Cities The data show the number of...Ch. 3.2 - Reaction Times In a study of reaction times to a...Ch. 3.2 - FM Radio Stations A random sample of 30 states...Ch. 3.2 - Murder Rates The data represent the murder rate...Ch. 3.2 - Waterfall Heights The frequency distribution shows...Ch. 3.2 - Baseball Team Batting Averages Team batting...Ch. 3.2 - Missing Work The average number of days that...Ch. 3.2 - Suspension Bridges The lengths (in feet) of the...Ch. 3.2 - Hospital Emergency Waiting Times The mean of the...Ch. 3.2 - Ages of Accountants The average age of the...Ch. 3.2 - Using Chebyshevs theorem, solve these problems for...Ch. 3.2 - The mean of a distribution is 20 and the standard...Ch. 3.2 - In a distribution of 160 values with a mean of 72,...Ch. 3.2 - Calories in Bagels The average number of calories...Ch. 3.2 - Time Spent Online Americans spend an average of 3...Ch. 3.2 - Solid Waste Production The average college student...Ch. 3.2 - Sale Price of Homes The average sale price of...Ch. 3.2 - Trials to Learn a Maze The average of the number...Ch. 3.2 - Farm Sizes The average farm in the United States...Ch. 3.2 - Citrus Fruit Consumption The average U.S. yearly...Ch. 3.2 - SAT Scores The national average for mathematics...Ch. 3.2 - Work Hours for College Faculty The average...Ch. 3.2 - Prices of Musical Instruments The average price of...Ch. 3.2 - Hours of Employment The mean and standard...Ch. 3.2 - Prob. 45ECh. 3.2 - Bonuses The mean and standard deviation of the...Ch. 3.2 - Serum Cholesterol Levels For this data set, find...Ch. 3.2 - Ages of Consumers For this data set, find the mean...Ch. 3.2 - Prob. 49ECCh. 3.2 - Use this data set: 10, 20, 30, 40, 50 a. Find the...Ch. 3.2 - Mean Deviation The mean deviation is found by...Ch. 3.2 - Pearson Coefficient of Skewness A measure to...Ch. 3.2 - All values of a data set must be within sn1 of the...Ch. 3.3 - Determining Dosages In an attempt to determine...Ch. 3.3 - What is a z score?Ch. 3.3 - Define percentile rank.Ch. 3.3 - What is the difference between a percentage and a...Ch. 3.3 - Define quartile.Ch. 3.3 - What is the relationship between quartiles and...Ch. 3.3 - What is a decile?Ch. 3.3 - How are deciles related to percentiles?Ch. 3.3 - To which percentile, quartile, and decile does the...Ch. 3.3 - Vacation Days If the average number of vacation...Ch. 3.3 - Age of Senators The average age of Senators in the...Ch. 3.3 - Marriage Age for Females The mean age at which...Ch. 3.3 - Teachers Salary The average teachers salary in a...Ch. 3.3 - Test Scores Which is a better relative position, a...Ch. 3.3 - College and University Debt A student graduated...Ch. 3.3 - Annual Miles Driven The average miles driven...Ch. 3.3 - Which score indicates the highest relative...Ch. 3.3 - The data show the population (in thousands) for a...Ch. 3.3 - College Room and Board Costs Room and board costs...Ch. 3.3 - Achievement Test Scores The data shown represent...Ch. 3.3 - Airplane Speeds The airborne speeds in miles per...Ch. 3.3 - Average Weekly Earnings The average weekly...Ch. 3.3 - Test Scores Find the percentile rank for each test...Ch. 3.3 - Hurricane Damage Find the percentile rank for each...Ch. 3.3 - Test Scores Find the percentile rank for each test...Ch. 3.3 - Taxes The data for a recent year show the taxes...Ch. 3.3 - Medical Marijuana 2015 Sales Tax: The data show...Ch. 3.3 - Gold Reserves The data show the gold reserves for...Ch. 3.3 - Police Calls in Schools The number of incidents in...Ch. 3.3 - Check each data set for outliers. a. 46, 28, 32,...Ch. 3.3 - Check each data set for outliers. a. 88, 72, 97,...Ch. 3.3 - Another measure of the average is called the...Ch. 3.3 - An employment evaluation exam has a variance of...Ch. 3.3 - A particular standardized test has scores that...Ch. 3.4 - Applying the Concepts 34 The Noisy Workplace...Ch. 3.4 - For Exercises 16, identify the five-number summary...Ch. 3.4 - For Exercises 16, identify the five-number summary...Ch. 3.4 - For Exercises 16, identify the five-number summary...Ch. 3.4 - For Exercises 16, identify the five-number summary...Ch. 3.4 - For Exercises 16, identify the five-number summary...Ch. 3.4 - For Exercises 16, identify the five-number summary...Ch. 3.4 - For Exercises 710, use each boxplot to identify...Ch. 3.4 - For Exercises 710, use each boxplot to identify...Ch. 3.4 - For Exercises 710, use each boxplot to identify...Ch. 3.4 - For Exercises 7-10. use each boxplot to identify-...Ch. 3.4 - School Graduation Rates The data show a sample of...Ch. 3.4 - Innings Pitched Construct a boxplot for the...Ch. 3.4 - Population of Colonies The data show the...Ch. 3.4 - Visitors Who Travel to Foreign Countries Construct...Ch. 3.4 - Areas of Islands The data show the sizes in square...Ch. 3.4 - Size of Dams These data represent the volumes in...Ch. 3.4 - Largest Dams The data show the heights (in feet)...Ch. 3.4 - Number of Tornadoes A four-month record for the...Ch. 3.4 - Unhealthy Smog Days A modified boxplot can be...Ch. 3 - Bank Failures The data show the number of bank...Ch. 3 - Shark Attacks The number of shark attacks and...Ch. 3 - AID: 1825 | 29/05/2018 3. Systolic Blood Pressure...Ch. 3 - SAT Scores The mean SAT math scores for selected...Ch. 3 - Households of Four Television Networks A survey...Ch. 3 - Investment Earnings An investor calculated these...Ch. 3 - Confirmed Measles Cases The data show a sample of...Ch. 3 - Tallest Buildings The number of stories in the 13...Ch. 3 - Rise in Tides Shown here is a frequency...Ch. 3 - Fuel Capacity The fuel capacity in gallons for...Ch. 3 - If the range of a data set is 24, find the...Ch. 3 - If the range of a data set is 56, find the...Ch. 3 - Textbooks in Professors Offices If the average...Ch. 3 - Magazines in Bookstores A survey of bookstores...Ch. 3 - Cost of Car Rentals A survey of car rental...Ch. 3 - AID: 1825 | 28/05/2018 16. Average Earnings of...Ch. 3 - Labor Charges The average labor charge for...Ch. 3 - Costs to Train Employees For a certain type of...Ch. 3 - Cost of a Mans Haircut The average cost of a mans...Ch. 3 - Exam Completion Time The mean time it takes a...Ch. 3 - Cases of Meningitis The data show the number of...Ch. 3 - Exam Grades Which of these exam grades has a...Ch. 3 - The number of police calls a small police...Ch. 3 - Printer Repairs The frequency distribution shows...Ch. 3 - Check each data set for outliers. a. 506, 511,...Ch. 3 - Check each data set for outliers. a. 14, 18, 27,...Ch. 3 - Named Storms The data show the number of named...Ch. 3 - Hours Worked The data shown here represent the...Ch. 3 - From the Data Bank, choose one of the following...Ch. 3 - Prob. 2DACh. 3 - Prob. 3DACh. 3 - Randomly select 10 values from the number of...Ch. 3 - Prob. 5DACh. 3 - AID: 1825 | 28/05/2018 Determine whether each...Ch. 3 - Prob. 2CQCh. 3 - Determine whether each statement is true or false....Ch. 3 - Prob. 4CQCh. 3 - In a data set, the mode will always be unique.Ch. 3 - Prob. 6CQCh. 3 - Determine whether each statement is true or false....Ch. 3 - Prob. 8CQCh. 3 - Determine whether each statement is true or false....Ch. 3 - Prob. 10CQCh. 3 - Prob. 11CQCh. 3 - Prob. 12CQCh. 3 - Which is not part of the five-number summary? a....Ch. 3 - A statistic that tells the number of standard...Ch. 3 - When a distribution is bell-shaped, approximately...Ch. 3 - Prob. 16CQCh. 3 - Generally, Greek letters are used to represent...Ch. 3 - Prob. 18CQCh. 3 - The symbol for the population standard deviation...Ch. 3 - When the sum of the lowest data value and the...Ch. 3 - If the mode is to the left of the median and the...Ch. 3 - An extremely high or extremely low data value is...Ch. 3 - Prob. 23CQCh. 3 - Prob. 24CQCh. 3 - Employee Years of Service In an advertisement, a...Ch. 3 - Newspapers for Sale The average number of...Ch. 3 - Prob. 27CQCh. 3 - Hours Worked The data shown here represent the...Ch. 3 - Prob. 29CQCh. 3 - Prob. 30CQCh. 3 - Exam Scores On a philosophy comprehensive exam,...Ch. 3 - Prob. 32CQCh. 3 - Prob. 1CTCCh. 3 - Ages of U.S. Residents The table shows the median...
Knowledge Booster
Background pattern image
Statistics
Learn more about
Need a deep-dive on the concept behind this application? Look no further. Learn more about this topic, statistics and related others by exploring similar questions and additional content below.
Recommended textbooks for you
Text book image
Glencoe Algebra 1, Student Edition, 9780079039897...
Algebra
ISBN:9780079039897
Author:Carter
Publisher:McGraw Hill
The Shape of Data: Distributions: Crash Course Statistics #7; Author: CrashCourse;https://www.youtube.com/watch?v=bPFNxD3Yg6U;License: Standard YouTube License, CC-BY
Shape, Center, and Spread - Module 20.2 (Part 1); Author: Mrmathblog;https://www.youtube.com/watch?v=COaid7O_Gag;License: Standard YouTube License, CC-BY
Shape, Center and Spread; Author: Emily Murdock;https://www.youtube.com/watch?v=_YyW0DSCzpM;License: Standard Youtube License