
Concept explainers
Videos
The U.S. Department of Health and Human Services reported the estimated percentage of households with only wireless phone service (no land line) in 2014 for the 50 U.S. states and the District of Columbia (cdc.gov/nchs/data/nhis/earlyrelease/wireless_state_201602.
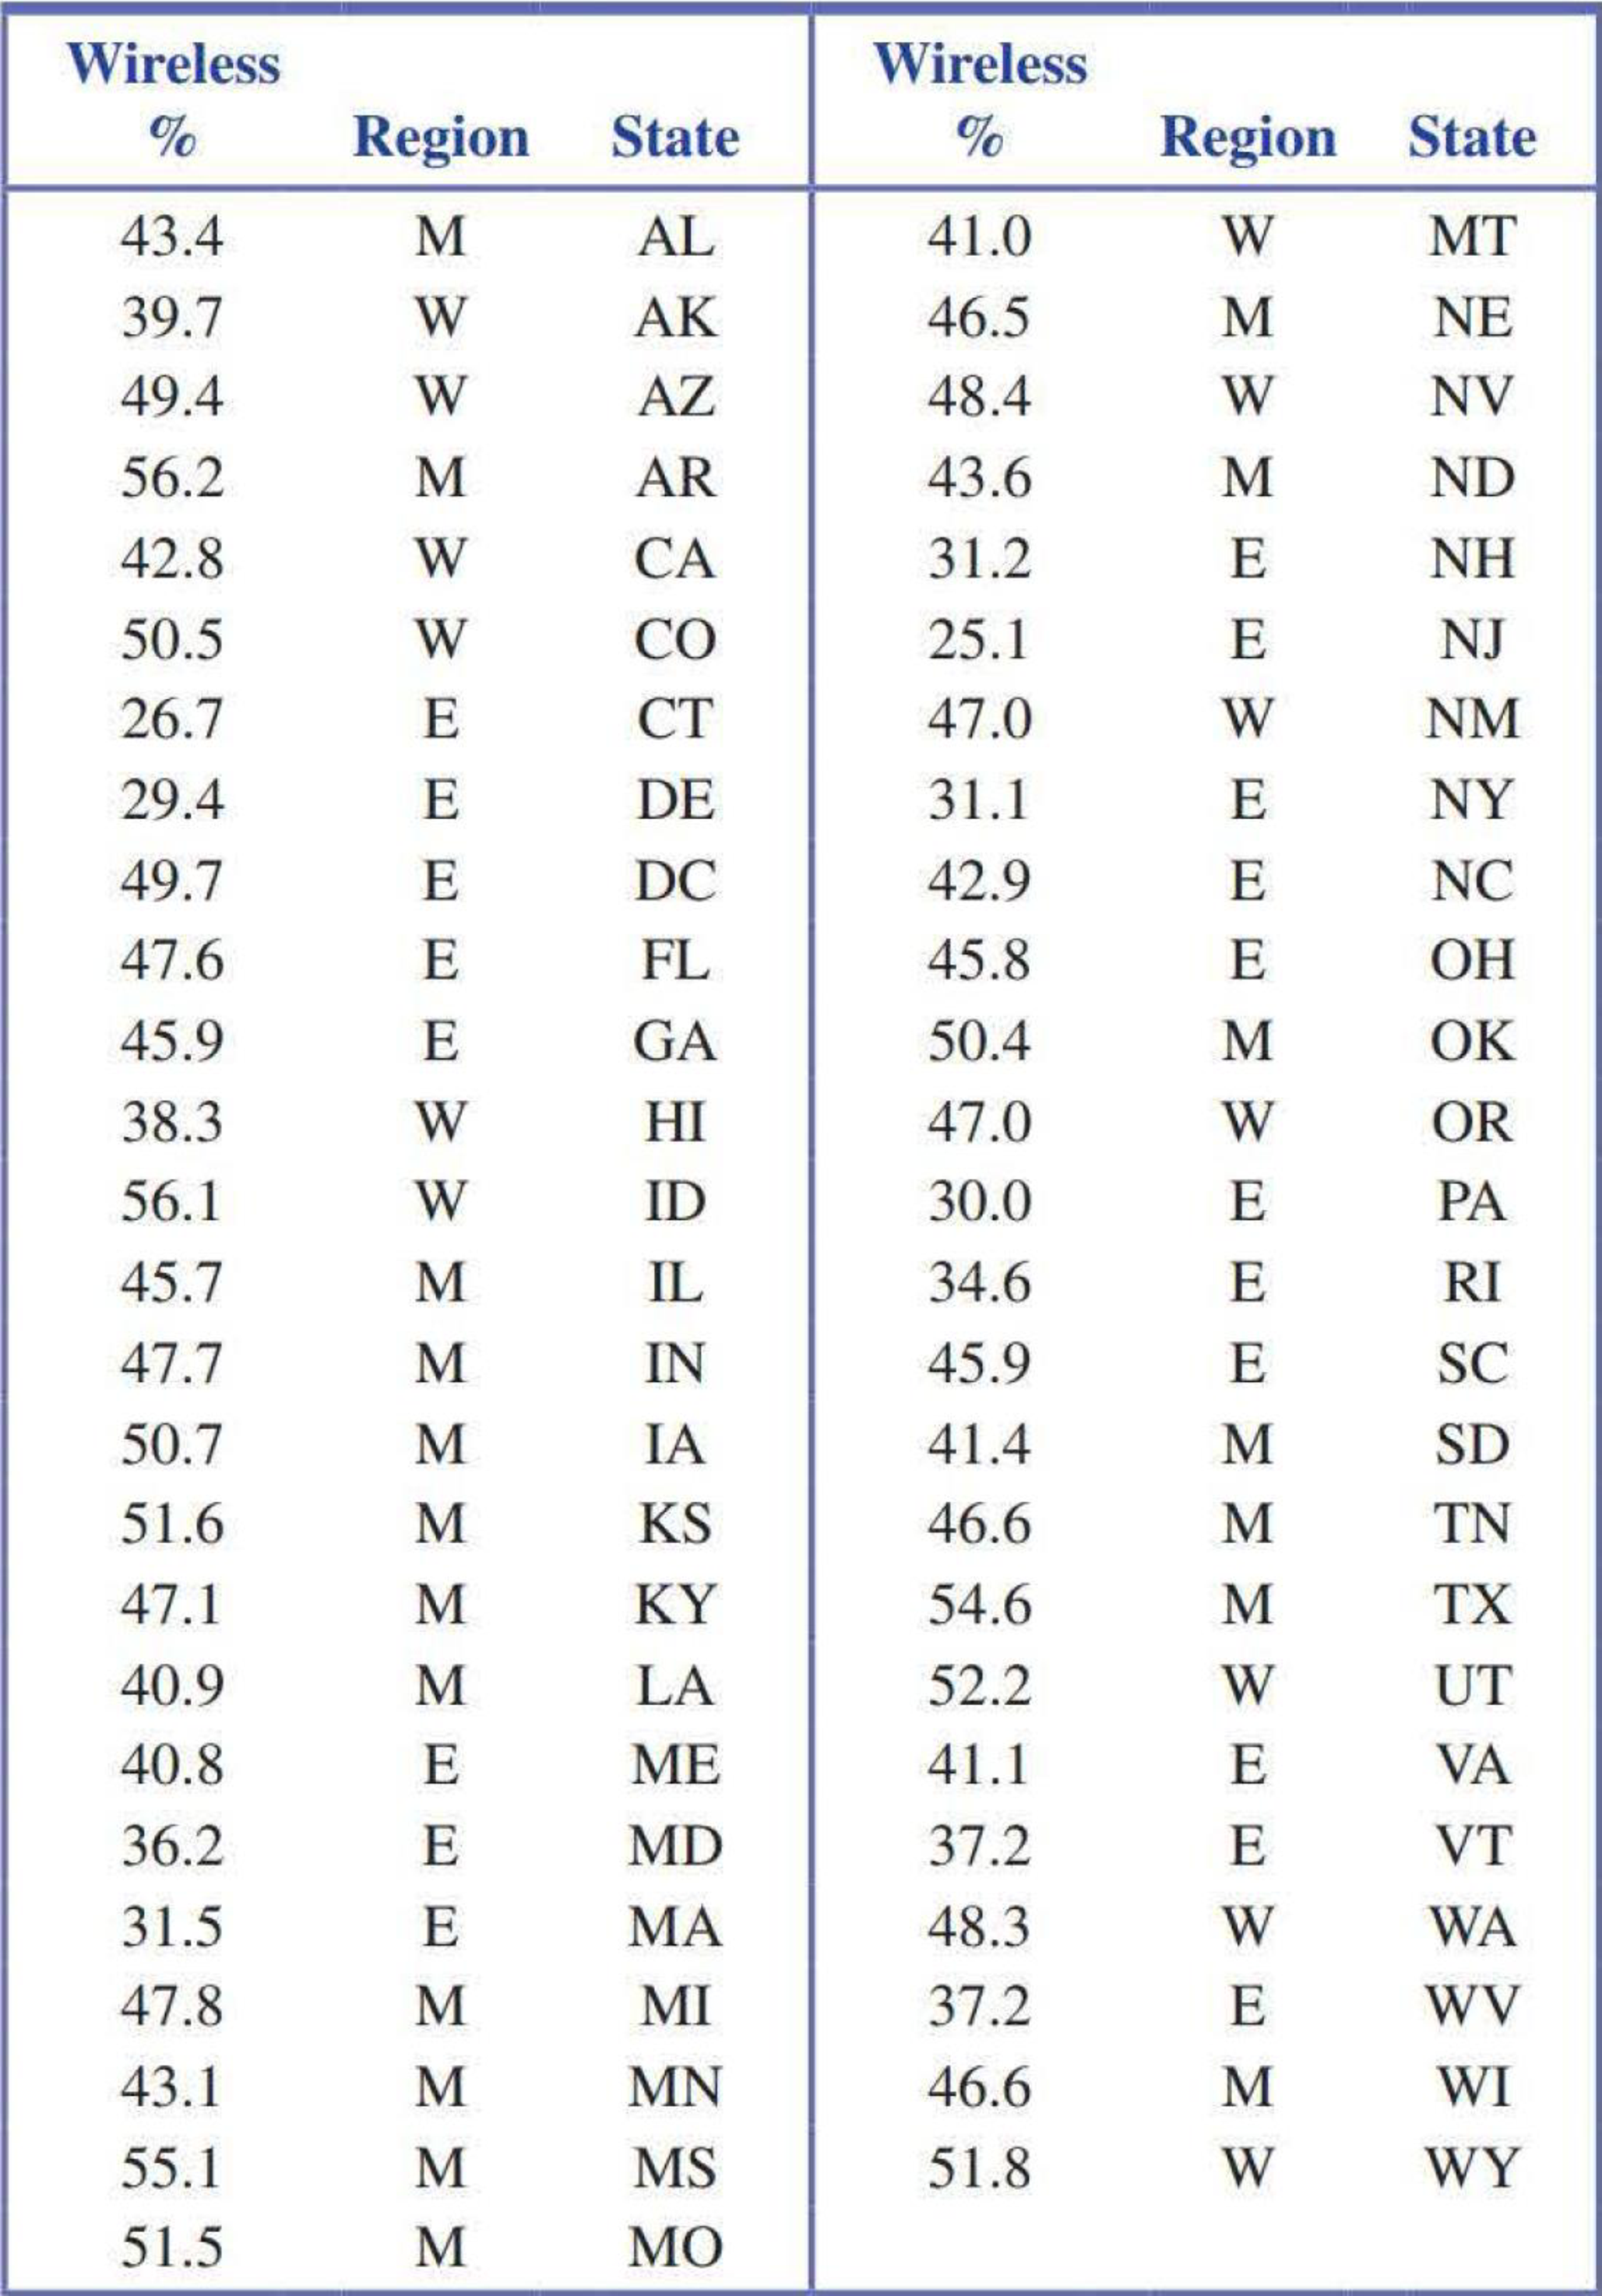
- a. Construct a stem-and-leaf display for the wireless percentage using the data from all 50 states and the District of Columbia. What is a typical value for this data set?
- b. Construct a comparative stem-and-leaf display for the wireless percentage of the states in the West and the states in the East. How do the distributions of wireless percentages compare for states in the East and states in the West? (Hint: See Example 3.11.)

Trending nowThis is a popular solution!

Chapter 3 Solutions
Introduction To Statistics And Data Analysis
Additional Math Textbook Solutions
The Practice of Statistics for AP - 4th Edition
Essential Statistics
Business Analytics
Elementary Statistics (Text Only)
Research Methods for the Behavioral Sciences (MindTap Course List)
Statistics for Business and Economics (13th Edition)


- What is a sample space?arrow_forwardList the sample space of each experiment. Picking a one-digit numberarrow_forwardThe Consumer Financial Protection Bureau's Consumer Response Team hears directly from consumers about the challenges they face in the marketplace , brings their concerns to the attention of financial institutions , and assists in addressing their complaints . Of the consumers who registered a bank account and service com plaint , 46 % cited " account management , " complaints related to the marketing or management of an account , as their complaint . Source : Consumer Response Annual Report , bit.ly/2x4CN5w . Consider a sample of 20 consumers who registered bank account and service complaints . Use the binomial model to answer the fol lowing questions : a . What is the expected value , or mean , of the binomial distribution ? b . What is the standard deviation of the binomial distribution ? c . What is the probability that 10 of the 20 consumers cited " account management " as the type of complaint ? d . What is the probability that no more than 5 of the consumers cited " account…arrow_forward
- The Hate Crime Statistics Act of 1990 requires the Attorney General to collect national data about crimes that manifest evidence of prejudice based on race, religion, sexualorientation, or ethnicity, including the crimes of murder and non-negligent manslaughter,forcible rape, aggravated assault, simple assault, intimidation, arson, and destruction, dam-age, or vandalism of property. The Hate Crime Data collected in 2005 reveals, based on arandomly selected sample of 500 incidents, that the mean number of victims in a particulartype of hate crime was 2.65, with a standard deviation of 1.22. Assuming that the numberof victims wasnormally distributed, answer the following questions. a) What proportion of crime incidents had more than three victims? b) What is the probability that there was more than one victim in an incident? c) What proportion of crime incidents had less than four victims? d) Construct and interpret an estimate of the population at the 95% level.arrow_forward6 Interpret the following cluster analysis data collected by people thinking of starting a nonprofit organization.arrow_forward
 Glencoe Algebra 1, Student Edition, 9780079039897...AlgebraISBN:9780079039897Author:CarterPublisher:McGraw Hill
 Holt Mcdougal Larson Pre-algebra: Student Edition...AlgebraISBN:9780547587776Author:HOLT MCDOUGALPublisher:HOLT MCDOUGAL
 College Algebra (MindTap Course List)AlgebraISBN:9781305652231Author:R. David Gustafson, Jeff HughesPublisher:Cengage Learning