Essential Statistics
2nd Edition
ISBN: 9781259570643
Author: Navidi
Publisher: MCG
bartleby

Concept explainers

bartleby

Videos

Question
Book Icon
Chapter 3.2, Problem 36E

a.

To determine

Find the population standard deviation for 2012.

a.

Expert Solution
Check Mark

Answer to Problem 36E

  • The population standard deviation for 2012 is 96.23.

Explanation of Solution

Calculation:

The price of single family homes in United States for the first quarter of 2012 and 2013 are given.

Standard deviation:

Let x1,x2...xN be the population observations of size N. the population mean is denoted by μ. Hence, the population variance can be expressed as,

σ=(xμ)2N=x2Nμ2N

Population standard deviation:

Finding mean:

Software procedure:

Step-by-step procedure to find mean using the MINITAB software:

  • Choose Stat > Basic Statistics > Display Descriptive Statistics.
  • In Variables enter the columns 2012.
  • Choose option statistics, and select Mean.
  • Click OK.

Output using the MINITAB software is given below:

  • Essential Statistics, Chapter 3.2, Problem 36E , additional homework tip  1
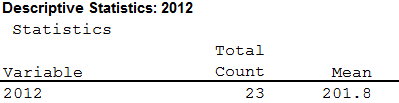
  • From the MINITAB output the mean is 201.8.

The deviation, deviation’s squares are calculated below:

x(xμ)(xμ)2
87.8–11412,996
218.116.3265.69
311.5109.712,034.09
157.2–44.61,989.16
112.5–89.37,974.49
84.9–116.913,665.61
148.2–53.62,872.96
226.424.6605.16
152.1–49.72,470.09
122.1–79.76,352.09
182–19.8392.04
147.3–54.52,970.25
363.816226,244
193.5–8.368.89
129.9–71.95,169.61
208.66.846.24
174.3–27.5756.25
103.7–98.19,623.61
359.5157.724,869.29
448246.260,614.44
265.463.64,044.96
131.9–69.94,886.01
311.6109.812,056.04
Total(xμ)2=21,2967

Substituting (xμ)2=21,2967 and N = 23 in the standard deviation formula,

σ=(xμ)2N=212,96723=96.23

  • Hence, the population standard deviation for 2012 is 96.23.

b.

To determine

Find the population standard deviation for 2013.

b.

Expert Solution
Check Mark

Answer to Problem 36E

  • The population standard deviation for 2013 is 115.99.

Explanation of Solution

Calculation:

Population standard deviation:

Finding mean:

Software procedure:

Step-by-step procedure to find mean using the MINITAB software:

  • Choose Stat > Basic Statistics > Display Descriptive Statistics.
  • In Variables enter the columns 2013.
  • Choose option statistics, and select Mean.
  • Click OK.

Output using the MINITAB software is given below:

  • Essential Statistics, Chapter 3.2, Problem 36E , additional homework tip  2
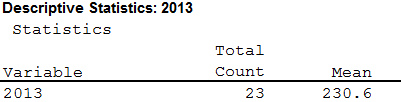
  • From the MINITAB output the mean is 230.6.

The deviation, deviation’s squares are calculated below:

x(xμ)(xμ)2
115.1–115.513,340.25
226.5–4.116.81
332.2101.610,322.56
159.4–71.25,069.44
121–109.612,012.16
101–129.616,796.16
160.4–70.24,928.04
261.230.6936.36
163.7–66.94,475.61
155.1–75.55,700.25
219.9–10.7114.49
170.6–603,600
368.2137.618,933.76
197.7–32.91,082.41
169–61.63,794.56
246.515.9252.81
216.7–13.9193.21
111–119.614,304.16
412.3181.733,014.89
593.9363.3131,986.9
312.6826,724
141.8–88.87,885.44
348.7118.113,947.61
Total(xμ)2=309,431.9

Substituting (xμ)2=309,431.9 and N = 23 in the standard deviation formula,

σ=(xμ)2N=309,431.923=115.99

  • Hence, the population standard deviation for 2013 is 115.99.

c.

To determine

Explain whether the spread in house price has increased or not.

c.

Expert Solution
Check Mark

Answer to Problem 36E

  • The spreads in house price for 2012 has increased in 2013.

Explanation of Solution

  • The house price has increased from 2012 to 2013.
  • From part (a), the population standard deviation for 2012 is 96.23.
  • From part (b), the population standard deviation for 2013 is 115.99.
  • The standard deviation for 2012 is less than the population standard deviation of 2013.
  • Thus, it can be concluded that the spreads in house price for 2012 has increased in 2013.

Want to see more full solutions like this?

Subscribe now to access step-by-step solutions to millions of textbook problems written by subject matter experts!

Chapter 3 Solutions

Essential Statistics

Ch. 3.1 - Prob. 11ECh. 3.1 - Prob. 12ECh. 3.1 - Prob. 13ECh. 3.1 - Prob. 14ECh. 3.1 - Prob. 15ECh. 3.1 - Prob. 16ECh. 3.1 - Prob. 17ECh. 3.1 - 18. Find the mean, median, and mode for the...Ch. 3.1 - Prob. 19ECh. 3.1 - In Exercises 19–22, use the given frequency...Ch. 3.1 - Prob. 21ECh. 3.1 - In Exercises 19–22, use the given frequency...Ch. 3.1 - Prob. 23ECh. 3.1 - Prob. 24ECh. 3.1 - Prob. 25ECh. 3.1 - Prob. 26ECh. 3.1 - Prob. 27ECh. 3.1 - Prob. 28ECh. 3.1 - Prob. 29ECh. 3.1 - 30. Mean and median height: The National Center...Ch. 3.1 - 31. Hamburgers: An ABC News story reported the...Ch. 3.1 - Prob. 32ECh. 3.1 - Prob. 33ECh. 3.1 - Prob. 34ECh. 3.1 - Prob. 35ECh. 3.1 - 36. Beer: The following table presents the number...Ch. 3.1 - Prob. 37ECh. 3.1 - Prob. 38ECh. 3.1 - 39. Heavy football players: Following are the...Ch. 3.1 - Prob. 40ECh. 3.1 - Prob. 41ECh. 3.1 - 42. News flash: The following table presents the...Ch. 3.1 - Prob. 43ECh. 3.1 - Prob. 44ECh. 3.1 - Prob. 45ECh. 3.1 - Prob. 46ECh. 3.1 - Prob. 47ECh. 3.1 - Prob. 48ECh. 3.1 - Prob. 49ECh. 3.1 - Prob. 50ECh. 3.1 - Prob. 51ECh. 3.1 - 52. Sources of news: A sample of 32 U.S. adults...Ch. 3.1 - Prob. 53ECh. 3.1 - Prob. 54ECh. 3.1 - Prob. 55ECh. 3.1 - Prob. 56ECh. 3.1 - Prob. 57ECh. 3.1 - Prob. 58ECh. 3.1 - Prob. 59ECh. 3.1 - Prob. 60ECh. 3.1 - Prob. 61ECh. 3.1 - Prob. 62ECh. 3.1 - Prob. 63ECh. 3.1 - Prob. 64ECh. 3.1 - Prob. 65ECh. 3.1 - Prob. 66ECh. 3.1 - Prob. 67ECh. 3.1 - Prob. 68ECh. 3.1 - Prob. 69ECh. 3.1 - Prob. 70ECh. 3.1 - Prob. 71ECh. 3.1 - Prob. 72ECh. 3.1 - Prob. 73ECh. 3.1 - Prob. 74ECh. 3.2 - 1. Compute the population variance for the St....Ch. 3.2 - Prob. 2CYUCh. 3.2 - Prob. 3CYUCh. 3.2 - Prob. 4CYUCh. 3.2 - Prob. 5CYUCh. 3.2 - Prob. 6CYUCh. 3.2 - Prob. 7CYUCh. 3.2 - Prob. 8CYUCh. 3.2 - Prob. 9ECh. 3.2 - In Exercises 9–12, fill in each blank with the...Ch. 3.2 - Prob. 11ECh. 3.2 - In Exercises 9–12, fill in each blank with the...Ch. 3.2 - Prob. 13ECh. 3.2 - In Exercises 13–16, determine whether the...Ch. 3.2 - Prob. 15ECh. 3.2 - Prob. 16ECh. 3.2 - Prob. 17ECh. 3.2 - 18. Find the sample variance and standard...Ch. 3.2 - Prob. 19ECh. 3.2 - Prob. 20ECh. 3.2 - Prob. 21ECh. 3.2 - Prob. 22ECh. 3.2 - 23. Approximate the sample variance and standard...Ch. 3.2 - 24. Approximate the sample variance and standard...Ch. 3.2 - Prob. 25ECh. 3.2 - Prob. 26ECh. 3.2 - Prob. 27ECh. 3.2 - Prob. 28ECh. 3.2 - Prob. 29ECh. 3.2 - Prob. 30ECh. 3.2 - Prob. 31ECh. 3.2 - Prob. 32ECh. 3.2 - 33. Heavy football players: Following are the...Ch. 3.2 - 34. Beer: The following table presents the number...Ch. 3.2 - Prob. 35ECh. 3.2 - Prob. 36ECh. 3.2 - Prob. 37ECh. 3.2 - Prob. 38ECh. 3.2 - Prob. 39ECh. 3.2 - Prob. 40ECh. 3.2 - Prob. 41ECh. 3.2 - 42. Pay your bills: In a large sample of customer...Ch. 3.2 - Prob. 43ECh. 3.2 - Prob. 44ECh. 3.2 - Prob. 45ECh. 3.2 - 46. Pay your bills: For the data in Exercise 42,...Ch. 3.2 - Prob. 47ECh. 3.2 - 48. Internet providers: For the data in Exercise...Ch. 3.2 - Prob. 49ECh. 3.2 - Prob. 50ECh. 3.2 - Prob. 51ECh. 3.2 - Prob. 52ECh. 3.2 - Prob. 53ECh. 3.2 - Prob. 54ECh. 3.2 - Prob. 55ECh. 3.2 - Prob. 56ECh. 3.2 - Prob. 57ECh. 3.2 - Prob. 58ECh. 3.2 - Prob. 59ECh. 3.2 - Prob. 60ECh. 3.2 - Prob. 61ECh. 3.2 - Prob. 62ECh. 3.2 - Prob. 63ECh. 3.3 - Following are final exam scores, arranged in...Ch. 3.3 - Prob. 2CYUCh. 3.3 - Prob. 3CYUCh. 3.3 - Prob. 4CYUCh. 3.3 - Prob. 5ECh. 3.3 - In Exercises 5–8, fill in each blank with the...Ch. 3.3 - Prob. 7ECh. 3.3 - In Exercises 5–8, fill in each blank with the...Ch. 3.3 - Prob. 9ECh. 3.3 - In Exercises 9–12, determine whether the statement...Ch. 3.3 - Prob. 11ECh. 3.3 - Prob. 12ECh. 3.3 - A population has mean μ = 7 and standard deviation...Ch. 3.3 - Prob. 14ECh. 3.3 - Prob. 15ECh. 3.3 - Prob. 16ECh. 3.3 - Prob. 17ECh. 3.3 - Prob. 18ECh. 3.3 - Prob. 19ECh. 3.3 - For the data set a. Find the 80th percentile. b....Ch. 3.3 - Standardized tests: In a recent year, the mean...Ch. 3.3 - A fish story: The mean length of one-year-old...Ch. 3.3 - Prob. 23ECh. 3.3 - Blood pressure in women: The article referred to...Ch. 3.3 - Hazardous waste: Following is a list of the number...Ch. 3.3 - Cholesterol levels: The National Health and...Ch. 3.3 - Commuting to work: Jamie drives to work every...Ch. 3.3 - Windy city by the bay: Following are wind speeds...Ch. 3.3 - Caffeine: Following are the number of grams of...Ch. 3.3 - Nuclear power: The following table presents the...Ch. 3.3 - Place your bets: Recently, 28 states in the U.S....Ch. 3.3 - Hail to the chief: There have been 57 presidential...Ch. 3.3 - Prob. 33ECh. 3.3 - Prob. 34ECh. 3.3 - Prob. 35ECh. 3.3 - Automotive emissions: Following are levels of...Ch. 3.3 - Prob. 37ECh. 3.3 - Prob. 38ECh. 3.3 - Prob. 39ECh. 3.3 - Boxplot possible? Following is the five-number...Ch. 3.3 - Unusual boxplot: Ten residents of a town were...Ch. 3.3 - Prob. 42ECh. 3.3 - The vanishing outlier: Seven families live on a...Ch. 3.3 - Prob. 44ECh. 3.3 - Prob. 45ECh. 3 - Of the mean, median, and mode, which must be a...Ch. 3 - Prob. 2CQCh. 3 - Prob. 3CQCh. 3 - Prob. 4CQCh. 3 - Prob. 5CQCh. 3 - Prob. 6CQCh. 3 - Each of the following histograms represents a data...Ch. 3 - Prob. 8CQCh. 3 - Prob. 9CQCh. 3 - Prob. 10CQCh. 3 - Prob. 11CQCh. 3 - Prob. 12CQCh. 3 - Prob. 13CQCh. 3 - Prob. 14CQCh. 3 - Prob. 15CQCh. 3 - Prob. 1RECh. 3 - Prob. 2RECh. 3 - Prob. 3RECh. 3 - Prob. 4RECh. 3 - Prob. 5RECh. 3 - Prob. 6RECh. 3 - Measure that ball: Each of 16 students measured...Ch. 3 - Prob. 8RECh. 3 - Prob. 9RECh. 3 - How long can you talk? A manufacturer of cell...Ch. 3 - Prob. 11RECh. 3 - Advertising costs: The amounts spent (in billions)...Ch. 3 - Prob. 13RECh. 3 - Prob. 14RECh. 3 - Prob. 15RECh. 3 - Prob. 1WAICh. 3 - Explain why the Empirical Rule is more useful than...Ch. 3 - Prob. 3WAICh. 3 - Prob. 4WAICh. 3 - Prob. 5WAICh. 3 - Prob. 1CSCh. 3 - Prob. 2CSCh. 3 - Prob. 3CSCh. 3 - Prob. 4CSCh. 3 - Prob. 5CSCh. 3 - Prob. 6CSCh. 3 - Prob. 7CSCh. 3 - Prob. 8CSCh. 3 - Prob. 9CS
Knowledge Booster
Background pattern image
Statistics
Learn more about
Need a deep-dive on the concept behind this application? Look no further. Learn more about this topic, statistics and related others by exploring similar questions and additional content below.
Recommended textbooks for you
Text book image
MATLAB: An Introduction with Applications
Statistics
ISBN:9781119256830
Author:Amos Gilat
Publisher:John Wiley & Sons Inc
Text book image
Probability and Statistics for Engineering and th...
Statistics
ISBN:9781305251809
Author:Jay L. Devore
Publisher:Cengage Learning
Text book image
Statistics for The Behavioral Sciences (MindTap C...
Statistics
ISBN:9781305504912
Author:Frederick J Gravetter, Larry B. Wallnau
Publisher:Cengage Learning
Text book image
Elementary Statistics: Picturing the World (7th E...
Statistics
ISBN:9780134683416
Author:Ron Larson, Betsy Farber
Publisher:PEARSON
Text book image
The Basic Practice of Statistics
Statistics
ISBN:9781319042578
Author:David S. Moore, William I. Notz, Michael A. Fligner
Publisher:W. H. Freeman
Text book image
Introduction to the Practice of Statistics
Statistics
ISBN:9781319013387
Author:David S. Moore, George P. McCabe, Bruce A. Craig
Publisher:W. H. Freeman
The Shape of Data: Distributions: Crash Course Statistics #7; Author: CrashCourse;https://www.youtube.com/watch?v=bPFNxD3Yg6U;License: Standard YouTube License, CC-BY
Shape, Center, and Spread - Module 20.2 (Part 1); Author: Mrmathblog;https://www.youtube.com/watch?v=COaid7O_Gag;License: Standard YouTube License, CC-BY
Shape, Center and Spread; Author: Emily Murdock;https://www.youtube.com/watch?v=_YyW0DSCzpM;License: Standard Youtube License