
Concept explainers
Videos
Use the relative frequency distribution constructed in the previous exercise to answer the following questions.
- a. Construct a cumulative relative frequency plot for the Medford rainfall data.
- b. Use the cumulative relative frequency plot of Part (a) to answer the following questions:
- i. Approximately what proportion of years had annual rainfall less than 15.5 inches?
- ii. Approximately what proportion of years had annual rainfall less than 25 inches?
- iii. Approximately what proportion of years had annual rainfall between 17.5 and 25 inches?
Example 3.19 used annual rainfall data for Albuquerque, New Mexico, to construct a relative frequency distribution and cumulative relative frequency plot. The National Climate Data Center also gave the accompanying annual rainfall (in inches) for Medford, Oregon, from 1950 to 2008.
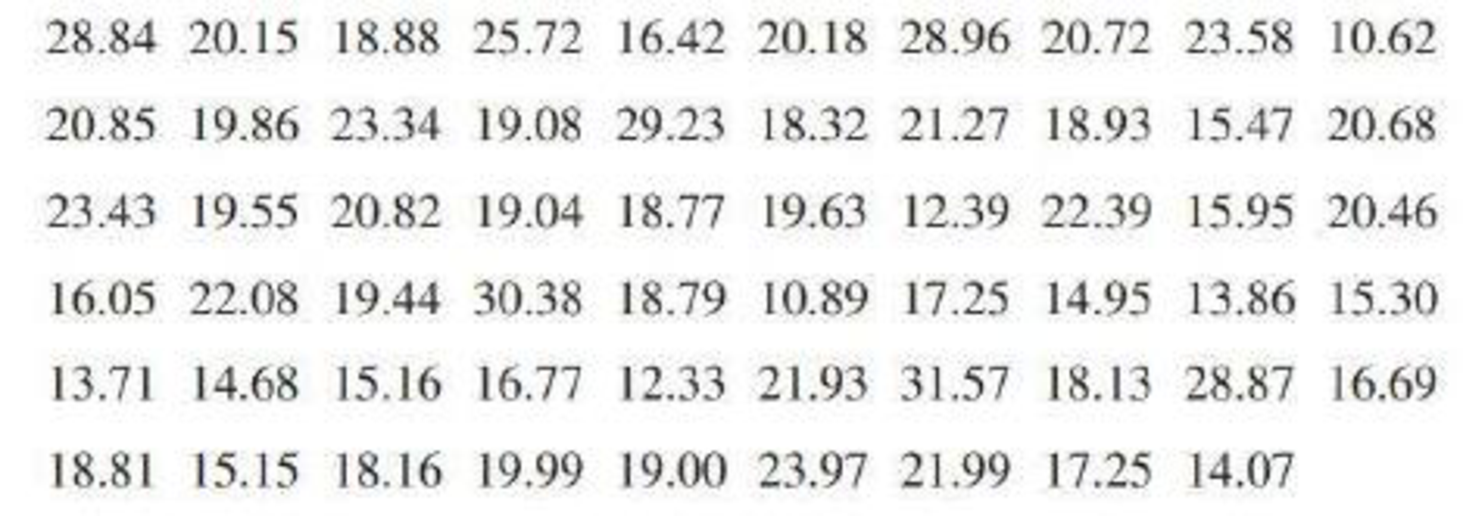
- a. Construct a relative frequency distribution for the Medford rainfall data.
- b. Use the relative frequency distribution of Part (a) to construct a histogram. Describe the shape of the histogram.

Trending nowThis is a popular solution!

Chapter 3 Solutions
Introduction To Statistics And Data Analysis
Additional Math Textbook Solutions
STATISTICS F/BUSINESS+ECONOMICS-TEXT
Fundamentals of Statistics (5th Edition)
Basic Business Statistics, Student Value Edition (13th Edition)
Essentials of Statistics, Books a la Carte Edition (5th Edition)
Statistics for Business & Economics, Revised (MindTap Course List)
Statistical Reasoning for Everyday Life (5th Edition)


 Glencoe Algebra 1, Student Edition, 9780079039897...AlgebraISBN:9780079039897Author:CarterPublisher:McGraw Hill