Subpart (a):
Long run equilibrium in AD-AS model.
Subpart (a):
Explanation of Solution
The supply depends upon the price level in the economy. When the price level is higher, the suppliers will be receiving higher income and this would incentivize them to increase the supply in the economy and vice versa. The aggregation of the supply curves of all the firms in the economy is known as the
The demand comes from all the economic agents such as the households, firms as well as the government. The demand depends on the price level of the economy. The increase and decrease in the price level determines the level of demand in the economy. The aggregation of all the individual demands in the economy is known as the aggregate demand thus, the aggregate demand explains the relationship between the general price level and the level of real
The equilibrium is a condition where the aggregate demand curve of the economy intersects with the aggregate supply curve of the economy. Then there will be an equilibrium point derived where the economy will be in its equilibrium without any excess demand or supply. The quantity on the X axis will represent the
Concept introduction:
Aggregate demand curve: It is the curve which shows the relationship between the price level in the economy and the quantity of real GDP demanded by the economic agents such as the households, firms as well as the government.
Equilibrium: The equilibrium in the economy is the point where the economy's aggregate demand curve and the aggregate supply curve intersects with each other. There will be no excess demand or
Subpart (b):
Long run equilibrium in AD-AS model.
Subpart (b):
Explanation of Solution
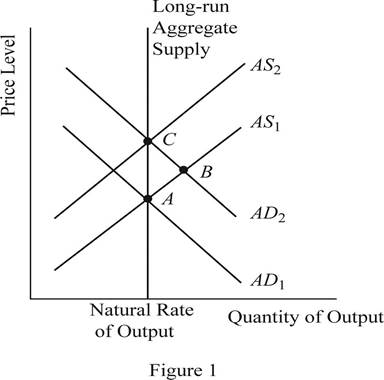
When the money supply of the economy increases with the intervention of the Central Bank of the economy, the money with the public will increase. When the money with the public increases, they will feel wealthier and as a result they will demand more consumer goods and services. As a result, the aggregate demand of the economy increases and it will shift the AD curve towards the right. This can be identified as the change to the equilibrium point B as shown in Figure 1. Thus, in short, the increase in the money supply leads to the increase in the output and price level of the economy.
Concept introduction:
Aggregate demand curve: It is the curve which shows the relationship between the price level in the economy and the quantity of real GDP demanded by the economic agents such as the households, firms as well as the government.
Aggregate supply curve: In the short run, it is a curve which shows the relationship between the price level in the economy and the supply in the economy by the firms. In the long run, it shows the relationship between the price level and the level of quantity supplied by the firms.
Equilibrium: The equilibrium in the economy is the point where the economy's aggregate demand curve and the aggregate supply curve intersects with each other. There will be no excess demand or excess supply in the economy at the equilibrium.
Subpart (c):
Long run equilibrium in AD-AS model.
Subpart (c):
Explanation of Solution
When the AD curve shifts towards the right and increases the output and the price level in the short run, over time, the nominal wages, prices as well as the perceptions and expectations of the economy would adjust to the new equilibrium level. As a result of this gradual adjustment, the cost of production will increase and the result will be a leftward shift in the aggregate supply curve of the economy. Then the economy will return to its natural level of output at a higher price level of the economy. This can be identified as the movement from point B to point C in the graph shown above.
Concept introduction:
Aggregate demand curve: It is the curve which shows the relationship between the price level in the economy and the quantity of real GDP demanded by the economic agents such as the households, firms as well as the government.
Aggregate supply curve: In the short run, it is a curve which shows the relationship between the price level in the economy and the supply in the economy by the firms. In the long run, it shows the relationship between the price level and the level of quantity supplied by the firms.
Equilibrium: The equilibrium in the economy is the point where the economy's aggregate demand curve and the aggregate supply curve intersects with each other. There will be no excess demand or excess supply in the economy at the equilibrium.
Subpart (d):
Long run equilibrium in AD-AS model.
Subpart (d):
Explanation of Solution
The sticky wages theory suggests that when there is inflation in the economy, the wage rate will adjust very slowly to the inflation. More or less the wage rates will be sticky and the main reason will be the long term contracts between the employer and the employees. Thus, in the short run equilibriums such as point A and point B, the wages of the economy would be more or less equal to each other. Whereas the point C represents the long run equilibrium and thus, the wages at the point C will be higher than that in point A and B.
Concept introduction:
Aggregate demand curve: It is the curve which shows the relationship between the price level in the economy and the quantity of real GDP demanded by the economic agents such as the households, firms as well as the government.
Aggregate supply curve: In the short run, it is a curve which shows the relationship between the price level in the economy and the supply in the economy by the firms. In the long run, it shows the relationship between the price level and the level of quantity supplied by the firms.
Equilibrium: The equilibrium in the economy is the point where the economy's aggregate demand curve and the aggregate supply curve intersects with each other. There will be no excess demand or excess supply in the economy at the equilibrium.
Subpart (e):
Long run equilibrium in AD-AS model.
Subpart (e):
Explanation of Solution
The sticky wages theory suggests that when there is inflation in the economy, the wage rate will adjust very slowly to the inflation. More or less, the wage rates will be sticky and the main reason will be the long term contracts between the employer and the employees. So, the nominal wages at equilibrium point A and B will be same. But the increase in the general price level in the economy would reduce the real wages of the workers because, the real wage is the nominal wage divided by the price level. When the denominator increases, it will reduce the value of the real wages in the economy.
Concept introduction:
Aggregate demand curve: It is the curve which shows the relationship between the price level in the economy and the quantity of real GDP demanded by the economic agents such as the households, firms as well as the government.
Aggregate supply curve: In the short run, it is a curve which shows the relationship between the price level in the economy and the supply in the economy by the firms. In the long run, it shows the relationship between the price level and the level of quantity supplied by the firms.
Equilibrium: The equilibrium in the economy is the point where the economy's aggregate demand curve and the aggregate supply curve intersects with each other. There will be no excess demand or excess supply in the economy at the equilibrium.
Sub part (f):
Long run equilibrium in AD-AS model.
Sub part (f):
Explanation of Solution
When the increase in the money supply happens in the economy, it will lead to the increase in the nominal wages as well as the price level in the economy in the long run. As a result of the increase in the nominal wage rate along with the price level in the economy, the real wage rate of the economy would remain unchanged. Thus, the neutrality of money applies in the long run equilibrium.
Concept introduction:
Aggregate demand curve: It is the curve which shows the relationship between the price level in the economy and the quantity of real GDP demanded by the economic agents such as the households, firms as well as the government.
Aggregate supply curve: In the short run, it is a curve which shows the relationship between the price level in the economy and the supply in the economy by the firms. In the long run, it shows the relationship between the price level and the level of quantity supplied by the firms.
Equilibrium: The equilibrium in the economy is the point where the economy's aggregate demand curve and the aggregate supply curve intersects with each other. There will be no excess demand or excess supply in the economy at the equilibrium.
Want to see more full solutions like this?
Chapter 33 Solutions
Principles of Economics (MindTap Course List)

- Suppose an economy is in long-run equilibrium. a. Use the model of aggregate demand and aggregate supply to illustrate the initial equilibrium (call it point A). Be sure to include both short-run and long-run aggregate supply. b. The central bank raises the money supply by 5 percent. Use your diagram to show what happens to output and the price level as the economy moves from the initial to the new short-run equilibrium (call it point B). c. Now show the new long-run equilibrium (call it point C). What causes the economy to move from point B to point C? d. According to the sticky-wage theory of aggregate supply, how do nominal wages at point A compare to nominal wages at point B? How do nominal wages at point A compare to nominal wages at point C? e. According to the sticky-wage theory of aggregate supply, how do real wages at point A compare to real wages at point B? How do real wages at point A compare to real wages at point C? f. Judging by the impact of the money supply on nominal…arrow_forwardNow suppose that a boom in stock market causes aggregate demand to rise. Use your diagram to show what happens to output and the price level in the short run. What happens to the unemployment rate? Draw a diagram to illustrate the state of the economy. Be sure to show aggregate demand, short-run aggregate supply, and long-run aggregate supply.arrow_forward4) Draw a graph that plots Short-run Aggregate Supply, Long.Run Aggregate Supply, and Aggregate Demand. Indicate the equilibrium point on the graph. Then, explain the shifts of the curves and the movement of equilibrium under the following events. 1. Government increases the income taxes 2. The war in Libya increases the price of oil globally 3. The lack of raw materials causing shortage of electronic chips used in many consumer electronics 4. New economic policy that attracts more investment Draw a new graph for each of these policy analysis. Show the movements of curves clearly. Explain the short run and the long run impact of each policy with a few sentences.arrow_forward
- What effects would each of the following have on aggregate demand or aggregate supply? In each case use a diagram to show the expected effects on the equilibrium price level and the level of real output. Assume all other things remain constant. a. The expectation of rapid inflation b. A 10 percent reduction in personal income tax rates c. A sizable increase in labor productivity (with no change in nominal wages) d. A 12 percent increase in nominal wages (with no change in productivity) e. Depreciation in the international value of the dollar.arrow_forward4 In Bangladesh, we are expecting that the price of food items will increase after a few weeks in Ramadan. How might this expectation of future prices affect the economy of Bangladesh right now? Use the Model of Aggregate Demand and Aggregate Supply to explain. Your answer should include a well-labelled diagram.arrow_forwardUse the dynamic model of aggregate demand and supply to illustrate a situation where the economy is growing but experiencing inflation in the long run.arrow_forward
- If the Federal Reserve wanted use an open market operation to combat a recession, what would they do, and what would its effect be? The Federal Reserve expands the money supply by 5%. Draw an aggregate supply/aggregate demand diagram to show the short run effect of this scenario. What happens to price and output? Which curve shifts? Which component of that curve accounts for the shift?arrow_forwardExplain the difference between long run and short run aggregate supply. Why do economists distinguish between the two?arrow_forwardWhat three factors affect long-run aggregate supply? A. Natural Resources, Technology, and unemployment B. Resources, technology, and institutions C. Interest rates, inflation, and the quantity of money D. None of the abovearrow_forward
- Draw lines for the long-run aggregate supply curve. Explain its shape and what can cause it to move in a few sentences. b. Now add in the short run aggregate supply curve. What explains its shape and what can cause it to move? c. On a new diagram, draw the aggregate demand curve. Explain its shape and what can cause it to shift. d. Why do we have short- and long-run supply curves but only one (ie not short or long-run) demand curve?arrow_forwardWhat determines aggregate supply in the short run and what determines it in the long run?arrow_forwardStarting with long run equilibrium, use the aggregate demand and aggregate supply model to illustrate what happens in the short run when the economy suffers a negative supply shock.arrow_forward

 Brief Principles of Macroeconomics (MindTap Cours...EconomicsISBN:9781337091985Author:N. Gregory MankiwPublisher:Cengage Learning
 Essentials of Economics (MindTap Course List)EconomicsISBN:9781337091992Author:N. Gregory MankiwPublisher:Cengage Learning
 Principles of Macroeconomics (MindTap Course List)EconomicsISBN:9781305971509Author:N. Gregory MankiwPublisher:Cengage Learning
 Principles of Economics, 7th Edition (MindTap Cou...EconomicsISBN:9781285165875Author:N. Gregory MankiwPublisher:Cengage Learning
 Principles of Economics (MindTap Course List)EconomicsISBN:9781305585126Author:N. Gregory MankiwPublisher:Cengage Learning