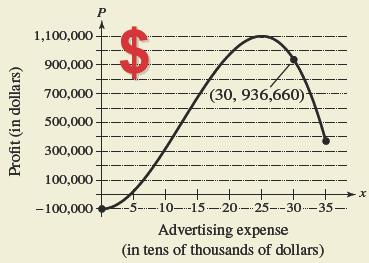
HOW DO YOU SEE IT? The graph below shows a company’s estimated profits for different advertising expenses. The company’s actual profit was $ 936 , 660 for an advertising expense of $ 300 , 000. (a) From the graph, it appears that the company could have obtained the same profit for a lesser advertising expense. Use the graph to estimate this expense. (b) The company’s model is P = – 140.75 x 3 + 5348.3 x 2 – 76 , 560 , 0 ≤ x ≤ 35 where P is the profit (in dollars) and x is the advertising expense (in tens of thousands of dollars).Explain how you could verify the lesser expense from part (a) algebraically.
HOW DO YOU SEE IT? The graph below shows a company’s estimated profits for different advertising expenses. The company’s actual profit was $ 936 , 660 for an advertising expense of $ 300 , 000. (a) From the graph, it appears that the company could have obtained the same profit for a lesser advertising expense. Use the graph to estimate this expense. (b) The company’s model is P = – 140.75 x 3 + 5348.3 x 2 – 76 , 560 , 0 ≤ x ≤ 35 where P is the profit (in dollars) and x is the advertising expense (in tens of thousands of dollars).Explain how you could verify the lesser expense from part (a) algebraically.
Solution Summary: The author analyzes how the company's profit at an advertising expense is 936,660 — the same profit also occurs at a lesser expense.
HOW DO YOU SEE IT? The graph below shows a company’s estimated profits for different advertising expenses. The company’s actual profit was
$
936
,
660
for an advertising expense of
$
300
,
000.
(a) From the graph, it appears that the company could have obtained the same profit for a lesser advertising expense. Use the graph to estimate this expense.
(b) The company’s model is
P
=
–
140.75
x
3
+
5348.3
x
2
–
76
,
560
,
0
≤
x
≤
35
where
P
is the profit (in dollars) and
x
is the advertising expense (in tens of thousands of dollars).Explain how you could verify the lesser expense from part (a) algebraically.
Revenue Demand for the latest best-seller at OHaganBooks.com, A River Burns through It, is given byq = -p2 +33p + 9 1(18 <= p <= 28)copies sold per week when the price is p dollars. What priceshould the company charge to obtain the largest revenue?
Algebra 2, Solving Polynomial Equations
If you are able to get the cube root, would you use SOPS?
I had a question that was x^3-8, and I put x=-2multiplicity of 3, is that correct?
Grade Inflation. The bar graph shows the percentage of U.S. college freshmen with an average grade of A in high school.The data displayed by the bar graph can be described by the mathematical model : p = (4x / 5) + 25, where x is the number of years after 1980 and p is the percentage of U.S. college freshmen who had an average grade of A in high school. Use this information to solve:
a. According to the formula, in 2010, what percentage of U.S. college freshmen had an average grade of A in high school? Does this underestimate or overestimate the percent displayed by the bar graph? By how much?
Need a deep-dive on the concept behind this application? Look no further. Learn more about this topic, algebra and related others by exploring similar questions and additional content below.


 Big Ideas Math A Bridge To Success Algebra 1: Stu...AlgebraISBN:9781680331141Author:HOUGHTON MIFFLIN HARCOURTPublisher:Houghton Mifflin Harcourt
 Holt Mcdougal Larson Pre-algebra: Student Edition...AlgebraISBN:9780547587776Author:HOLT MCDOUGALPublisher:HOLT MCDOUGAL
 Glencoe Algebra 1, Student Edition, 9780079039897...AlgebraISBN:9780079039897Author:CarterPublisher:McGraw Hill