
Elementary Statistics: A Step By Step Approach
9th Edition
ISBN: 9780073534985
Author: Allan Bluman
Publisher: McGraw-Hill Science/Engineering/Math
expand_more
expand_more
format_list_bulleted
Concept explainers
Videos
Textbook Question
Chapter 3.4, Problem 1AC
Applying the Concepts 3–4
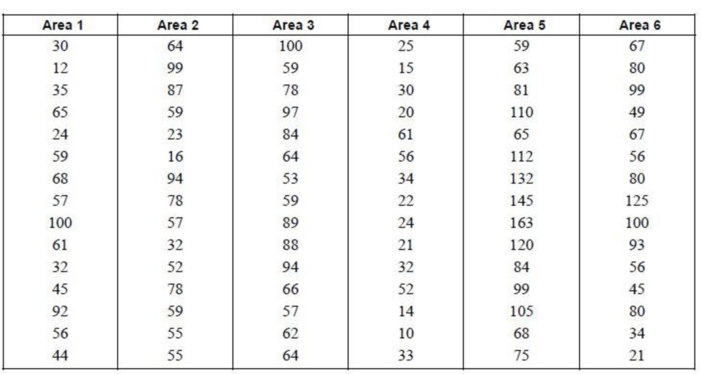
The Noisy Workplace
Assume you work for OSHA (Occupational Safety and Health Administration) and have complaints about noise levels from some of the workers at a state power plant. You charge the power plant with taking decibel readings at six different areas of the plant at different times of the day and week. The results of the data collection are listed. Use boxplots to initially explore the data and make recommendations about which plant areas workers must be provided with protective ear wear. The safe hearing level is approximately 120 decibels.
Expert Solution & Answer

Trending nowThis is a popular solution!

Chapter 3 Solutions
Elementary Statistics: A Step By Step Approach
Ch. 3.1 - Teacher Salaries The following data from several...Ch. 3.1 - Prob. 1ECh. 3.1 - Prob. 2ECh. 3.1 - Prob. 3ECh. 3.1 - Observers in the Frogwatch Program The number of...Ch. 3.1 - Prob. 5ECh. 3.1 - Earnings of Nonliving Celebrities Forbes magazine...Ch. 3.1 - Prob. 7ECh. 3.1 - Top-Paid CEOs The data shown are the total...Ch. 3.1 - Prob. 9E
Ch. 3.1 - Foreign Workers The number of foreign workers...Ch. 3.1 - Distances of Stars Of the 25 brightest stars, the...Ch. 3.1 - Contest Spelling Words The last words given and...Ch. 3.1 - Prob. 13ECh. 3.1 - Hourly Compensation for Production Workers The...Ch. 3.1 - Prob. 15ECh. 3.1 - Percentage of Foreign-Born People The percentage...Ch. 3.1 - Percentage of College-Educated Population over 25...Ch. 3.1 - Net Worth of Corporations These data represent the...Ch. 3.1 - Specialty Coffee Shops A random sample of 30...Ch. 3.1 - Commissions Earned This frequency distribution...Ch. 3.1 - Prob. 21ECh. 3.1 - Enrollments for Selected Independent Religiously...Ch. 3.1 - Automobile Selling Prices Find the weighted mean...Ch. 3.1 - Fat Grams Using the weighted mean, find the...Ch. 3.1 - Diet Cola Preference A recent survey of a new diet...Ch. 3.1 - Costs of Helicopters The costs of three models of...Ch. 3.1 - Final Grade An instructor grades exams, 20%; term...Ch. 3.1 - Final Grade Another instructor gives four 1-hour...Ch. 3.1 - For these situations, state which measure of...Ch. 3.1 - Describe which measure of central tendencymean,...Ch. 3.1 - What types of symbols are used to represent sample...Ch. 3.1 - A local fast-food company claims that the average...Ch. 3.1 - If the mean of five values is 64, find the sum of...Ch. 3.1 - If the mean of five values is 8.2 and four of the...Ch. 3.1 - Find the mean of 10, 20, 30, 40, and 50. a. Add 10...Ch. 3.1 - Harmonic Mean The harmonic mean (HM) is defined as...Ch. 3.1 - Geometric Mean The geometric mean (GM) is defined...Ch. 3.1 - Quadratic Mean A useful mean in the physical...Ch. 3.1 - Median for Grouped Data An approximate median can...Ch. 3.2 - Blood Pressure The table lists means and standard...Ch. 3.2 - What is the relationship between the variance and...Ch. 3.2 - Why might the range not be the best estimate of...Ch. 3.2 - What are the symbols used to represent the...Ch. 3.2 - What are the symbols used to represent the sample...Ch. 3.2 - Why is the unbiased estimator of variance used?Ch. 3.2 - The three data sets have the same mean and range,...Ch. 3.2 - Prob. 7ECh. 3.2 - Cigarette Taxes The increases (in cents) in...Ch. 3.2 - Prob. 9ECh. 3.2 - Size of U.S. States The total surface area (in...Ch. 3.2 - Multiple Births The numbers of various multiple...Ch. 3.2 - Starting Teachers Salaries Starting teachers...Ch. 3.2 - Ages of U.S. Astronaut Candidates The average age...Ch. 3.2 - Times Spent in Rush-Hour Traffic A sample of 12...Ch. 3.2 - Prob. 15ECh. 3.2 - Passenger Vehicle Deaths The number of people...Ch. 3.2 - Annual Precipitation Days The number of annual...Ch. 3.2 - Use the data from Exercises 7, 15, and 17...Ch. 3.2 - Prob. 19ECh. 3.2 - Automotive Fuel Efficiency Thirty automobiles were...Ch. 3.2 - Murders in Cities The data show the number of...Ch. 3.2 - Reaction Times In a study of reaction times to a...Ch. 3.2 - FM Radio Stations A random sample of 30 states...Ch. 3.2 - Murder Rates The data represent the murder rate...Ch. 3.2 - Prob. 25ECh. 3.2 - Prob. 26ECh. 3.2 - Missing Work The average number of days that...Ch. 3.2 - Suspension Bridges The lengths (in feet) of the...Ch. 3.2 - Hospital Emergency Waiting Times The mean of the...Ch. 3.2 - Ages of Accountants The average age of the...Ch. 3.2 - Using Chebyshevs theorem, solve these problems for...Ch. 3.2 - The mean of a distribution is 20 and the standard...Ch. 3.2 - In a distribution of 160 values with a mean of 72,...Ch. 3.2 - Calories in Bagels The average number of calories...Ch. 3.2 - Time Spent Online Americans spend an average of 3...Ch. 3.2 - Solid Waste Production The average college student...Ch. 3.2 - Sale Price of Homes The average sale price of...Ch. 3.2 - Trials to Learn a Maze The average of the number...Ch. 3.2 - Farm Sizes The average farm in the United States...Ch. 3.2 - Citrus Fruit Consumption The average U.S. yearly...Ch. 3.2 - SAT Scores The national average for mathematics...Ch. 3.2 - Work Hours for College Faculty The average...Ch. 3.2 - Serum Cholesterol Levels For this data set, find...Ch. 3.2 - Ages of Consumers For this data set, find the mean...Ch. 3.2 - Prob. 45ECCh. 3.2 - Use this data set: 10, 20, 30, 40, 50 a. Find the...Ch. 3.2 - Mean Deviation The mean deviation is found by...Ch. 3.2 - All values of a data set must be within sn1 of the...Ch. 3.2 - Pearson Coefficient of Skewness A measure to...Ch. 3.3 - Determining Dosages In an attempt to determine...Ch. 3.3 - What is a z score?Ch. 3.3 - Define percentile rank.Ch. 3.3 - What is the difference between a percentage and a...Ch. 3.3 - Define quartile.Ch. 3.3 - What is the relationship between quartiles and...Ch. 3.3 - What is a decile?Ch. 3.3 - How are deciles related to percentiles?Ch. 3.3 - To which percentile, quartile, and decile does the...Ch. 3.3 - Vacation Days If the average number of vacation...Ch. 3.3 - Age of Senators The average age of Senators in the...Ch. 3.3 - Prob. 11ECh. 3.3 - Teachers Salary The average teachers salary in a...Ch. 3.3 - Prob. 13ECh. 3.3 - College and University Debt A student graduated...Ch. 3.3 - Annual Miles Driven The average miles driven...Ch. 3.3 - Which score indicates the highest relative...Ch. 3.3 - College Room and Board Costs Room and board costs...Ch. 3.3 - Prob. 19ECh. 3.3 - Airplane Speeds The airborne speeds in miles per...Ch. 3.3 - Average Weekly Earnings The average weekly...Ch. 3.3 - Test Scores Find the percentile rank for each test...Ch. 3.3 - Hurricane Damage Find the percentile rank for each...Ch. 3.3 - Test Scores Find the percentile rank for each test...Ch. 3.3 - Prob. 25ECh. 3.3 - Prob. 26ECh. 3.3 - Prob. 27ECh. 3.3 - Police Calls in Schools The number of incidents in...Ch. 3.3 - Prob. 29ECh. 3.3 - Check each data set for outliers. a. 88, 72, 97,...Ch. 3.3 - Another measure of the average is called the...Ch. 3.3 - An employment evaluation exam has a variance of...Ch. 3.3 - A particular standardized test has scores that...Ch. 3.4 - Applying the Concepts 34 The Noisy Workplace...Ch. 3.4 - For Exercises 16, identify the five-number summary...Ch. 3.4 - For Exercises 16, identify the five-number summary...Ch. 3.4 - For Exercises 16, identify the five-number summary...Ch. 3.4 - For Exercises 16, identify the five-number summary...Ch. 3.4 - For Exercises 16, identify the five-number summary...Ch. 3.4 - For Exercises 16, identify the five-number summary...Ch. 3.4 - For Exercises 710, use each boxplot to identify...Ch. 3.4 - For Exercises 710, use each boxplot to identify...Ch. 3.4 - For Exercises 710, use each boxplot to identify...Ch. 3.4 - For Exercises 7-10. use each boxplot to identify-...Ch. 3.4 - Prob. 11ECh. 3.4 - Prob. 12ECh. 3.4 - Prob. 13ECh. 3.4 - Visitors Who Travel to Foreign Countries Construct...Ch. 3.4 - Prob. 15ECh. 3.4 - Size of Dams These data represent the volumes in...Ch. 3.4 - Prob. 17ECh. 3.4 - Prob. 18ECh. 3.4 - Unhealthy Smog Days A modified boxplot can be...Ch. 3 - Prob. 3.1.1RECh. 3 - Shark Attacks The number of shark attacks and...Ch. 3 - Prob. 3.1.3RECh. 3 - SAT Scores The mean SAT math scores for selected...Ch. 3 - Households of Four Television Networks A survey...Ch. 3 - Investment Earnings An investor calculated these...Ch. 3 - Prob. 3.2.7RECh. 3 - Tallest Buildings The number of stories in the 13...Ch. 3 - Rise in Tides Shown here is a frequency...Ch. 3 - Fuel Capacity The fuel capacity in gallons for...Ch. 3 - If the range of a data set is 24, find the...Ch. 3 - If the range of a data set is 56, find the...Ch. 3 - Textbooks in Professors Offices If the average...Ch. 3 - Magazines in Bookstores A survey of bookstores...Ch. 3 - Cost of Car Rentals A survey of car rental...Ch. 3 - AID: 1825 | 28/05/2018 16. Average Earnings of...Ch. 3 - Labor Charges The average labor charge for...Ch. 3 - Costs to Train Employees For a certain type of...Ch. 3 - Prob. 3.2.19RECh. 3 - Exam Completion Time The mean time it takes a...Ch. 3 - Prob. 3.2.21RECh. 3 - Exam Grades Which of these exam grades has a...Ch. 3 - Prob. 3.3.23RECh. 3 - Printer Repairs The frequency distribution shows...Ch. 3 - Check each data set for outliers. a. 506, 511,...Ch. 3 - Check each data set for outliers. a. 14, 18, 27,...Ch. 3 - Named Storms The data show the number of named...Ch. 3 - Hours Worked The data shown here represent the...Ch. 3 - From the Data Bank, choose one of the following...Ch. 3 - Prob. 2DACh. 3 - Prob. 3DACh. 3 - Randomly select 10 values from the number of...Ch. 3 - Prob. 5DACh. 3 - AID: 1825 | 28/05/2018 Determine whether each...Ch. 3 - Prob. 2CQCh. 3 - Determine whether each statement is true or false....Ch. 3 - Prob. 4CQCh. 3 - In a data set, the mode will always be unique.Ch. 3 - Prob. 6CQCh. 3 - Determine whether each statement is true or false....Ch. 3 - Prob. 8CQCh. 3 - Determine whether each statement is true or false....Ch. 3 - Prob. 10CQCh. 3 - Prob. 11CQCh. 3 - Prob. 12CQCh. 3 - Which is not part of the five-number summary? a....Ch. 3 - A statistic that tells the number of standard...Ch. 3 - When a distribution is bell-shaped, approximately...Ch. 3 - Prob. 16CQCh. 3 - Generally, Greek letters are used to represent...Ch. 3 - Prob. 18CQCh. 3 - The symbol for the population standard deviation...Ch. 3 - When the sum of the lowest data value and the...Ch. 3 - If the mode is to the left of the median and the...Ch. 3 - An extremely high or extremely low data value is...Ch. 3 - Prob. 23CQCh. 3 - Prob. 24CQCh. 3 - Employee Years of Service In an advertisement, a...Ch. 3 - Newspapers for Sale The average number of...Ch. 3 - Prob. 27CQCh. 3 - Hours Worked The data shown here represent the...Ch. 3 - Prob. 29CQCh. 3 - Prob. 30CQCh. 3 - Exam Scores On a philosophy comprehensive exam,...Ch. 3 - Prob. 32CQCh. 3 - Prob. 1CTCCh. 3 - Ages of U.S. Residents The table shows the median...
Knowledge Booster


Learn more about
Need a deep-dive on the concept behind this application? Look no further. Learn more about this topic, statistics and related others by exploring similar questions and additional content below.Similar questions
- Urban Travel Times Population of cities and driving times are related, as shown in the accompanying table, which shows the 1960 population N, in thousands, for several cities, together with the average time T, in minutes, sent by residents driving to work. City Population N Driving time T Los Angeles 6489 16.8 Pittsburgh 1804 12.6 Washington 1808 14.3 Hutchinson 38 6.1 Nashville 347 10.8 Tallahassee 48 7.3 An analysis of these data, along with data from 17 other cities in the United States and Canada, led to a power model of average driving time as a function of population. a Construct a power model of driving time in minutes as a function of population measured in thousands b Is average driving time in Pittsburgh more or less than would be expected from its population? c If you wish to move to a smaller city to reduce your average driving time to work by 25, how much smaller should the city be?arrow_forwardWeight Versus Height The following data show the height h, in inches, and weight w, in pounds, of an average adult male. h 61 62 66 68 70 72 74 75 w 131 133 143 149 155 162 170 175 a Make a power model for weight versus height. b According to the model from part a, what percentage increase in weight can be expected if height is increased by 10?arrow_forward
Recommended textbooks for you
 Glencoe Algebra 1, Student Edition, 9780079039897...AlgebraISBN:9780079039897Author:CarterPublisher:McGraw Hill
 Functions and Change: A Modeling Approach to Coll...AlgebraISBN:9781337111348Author:Bruce Crauder, Benny Evans, Alan NoellPublisher:Cengage Learning
 Linear Algebra: A Modern IntroductionAlgebraISBN:9781285463247Author:David PoolePublisher:Cengage Learning
 Algebra & Trigonometry with Analytic GeometryAlgebraISBN:9781133382119Author:SwokowskiPublisher:Cengage
 Big Ideas Math A Bridge To Success Algebra 1: Stu...AlgebraISBN:9781680331141Author:HOUGHTON MIFFLIN HARCOURTPublisher:Houghton Mifflin Harcourt
 Holt Mcdougal Larson Pre-algebra: Student Edition...AlgebraISBN:9780547587776Author:HOLT MCDOUGALPublisher:HOLT MCDOUGAL
Glencoe Algebra 1, Student Edition, 9780079039897...
Algebra
ISBN:9780079039897
Author:Carter
Publisher:McGraw Hill
Functions and Change: A Modeling Approach to Coll...
Algebra
ISBN:9781337111348
Author:Bruce Crauder, Benny Evans, Alan Noell
Publisher:Cengage Learning
Linear Algebra: A Modern Introduction
Algebra
ISBN:9781285463247
Author:David Poole
Publisher:Cengage Learning
Algebra & Trigonometry with Analytic Geometry
Algebra
ISBN:9781133382119
Author:Swokowski
Publisher:Cengage
Big Ideas Math A Bridge To Success Algebra 1: Stu...
Algebra
ISBN:9781680331141
Author:HOUGHTON MIFFLIN HARCOURT
Publisher:Houghton Mifflin Harcourt
Holt Mcdougal Larson Pre-algebra: Student Edition...
Algebra
ISBN:9780547587776
Author:HOLT MCDOUGAL
Publisher:HOLT MCDOUGAL
The Shape of Data: Distributions: Crash Course Statistics #7; Author: CrashCourse;https://www.youtube.com/watch?v=bPFNxD3Yg6U;License: Standard YouTube License, CC-BY
Shape, Center, and Spread - Module 20.2 (Part 1); Author: Mrmathblog;https://www.youtube.com/watch?v=COaid7O_Gag;License: Standard YouTube License, CC-BY
Shape, Center and Spread; Author: Emily Murdock;https://www.youtube.com/watch?v=_YyW0DSCzpM;License: Standard Youtube License