
Introduction To Statistics And Data Analysis
6th Edition
ISBN: 9781337793612
Author: PECK, Roxy.
Publisher: Cengage Learning,
expand_more
expand_more
format_list_bulleted
Concept explainers
Videos
Textbook Question
Chapter 3.4, Problem 46E
The report “Daily Cigarette Use: Indicators on Children and Youth” (Child Trends Data Bank, chi ldtrends.org/wp-content/uploads/2012/11 /03_Smoking_new.pdf, retrieved April 17, 2017) included the accompanying data on the percentage of students who report smoking cigarettes daily, for students in grades 8, 10, and 12.
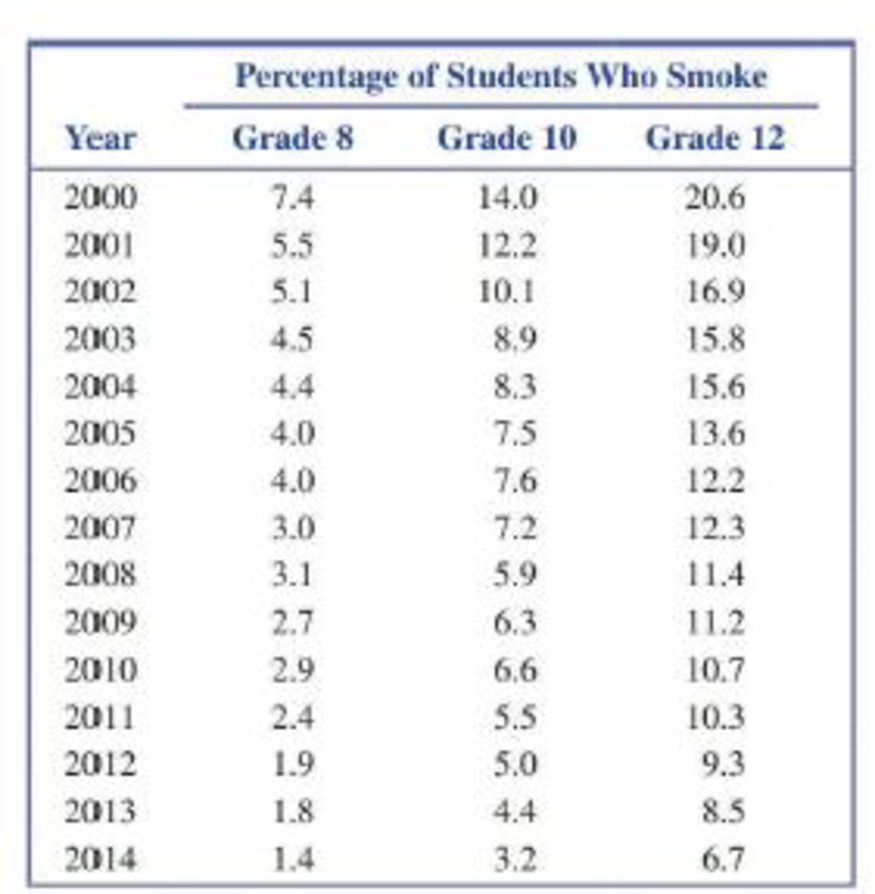
- a. Construct a time series plot for students in grade 12, and comment on any trend over time.
- b. Construct a time series plot that shows trends over time for each of the three grade levels. Graph each of the three time series on the same set of axes, using different colors to distinguish the different grade levels. Either label the time series in the plot or include a legend to indicate which time series corresponds to which grade level.
- c. Write a paragraph based on the plot from Part (b). Discuss the similarities and differences for the three grade levels.
Expert Solution & Answer
Want to see the full answer?
Check out a sample textbook solution
Students have asked these similar questions
Could it be that smoking actually increases survival rates among women? The accompanying data represent the 20-year survival status and smoking status of
1339 women who participated in a 20-year cohort study. Complete parts (a) through (e).
A Bloomberg Businessweek North American subscriber study collected data from asample of 2861 subscribers. Fifty-nine percent of the respondents indicated an annualincome of $75,000 or more, and 50% reported having an American Express credit card.a. What is the population of interest in this study?b. Is annual income a categorical or quantitative variable?c. Is ownership of an American Express card a categorical or quantitative variable?d. Does this study involve cross-sectional or time series data?e. Describe any statistical inferences Bloomberg Businessweek might make on the basisof the survey
This is from a recent news article about a study on children using drugs: “The researchers analyzed the data to estimate the average age at first-time use for 18 internationally regulated drugs for each year included in the study. Looking at year-to-year trends, they found that the average age at first use had increased for 12 out of 18 drugs, including alcohol, cocaine, ecstasy, hallucinogens, heroin, inhalants, LSD, marijuana, stimulants, and tobacco products such as cigars, cigarettes and smokeless tobacco. For the other six drugs— crack cocaine, methamphetamines, opioids, PCP, sedatives, and tranquilizers—they found no statistically significant changes in the age at first use.” Write one or two sentences interpreting the bold finding at the end of the paragraph
Chapter 3 Solutions
Introduction To Statistics And Data Analysis
Ch. 3.1 - Each person in a nationally representative sample...Ch. 3.1 - The graphical display on the next page is similar...Ch. 3.1 - The survey referenced in the previous exercise was...Ch. 3.1 - The National Confectioners Association asked 1006...Ch. 3.1 - College student attitudes about e-books were...Ch. 3.1 - The Center for Science in the Public Interest...Ch. 3.1 - Using the data given in the previous exercise,...Ch. 3.1 - The article Housework around the World (USA TODAY,...Ch. 3.1 - The authors of the report Findings from the 2009...Ch. 3.1 - The survey on student attitude toward e-books...
Ch. 3.1 - During 2017, Gallup conducted a survey of adult...Ch. 3.1 - An article about college loans (New Rules Would...Ch. 3.1 - The report Findings From the 2014 College Senior...Ch. 3.2 - The National Center for Health Statistics provided...Ch. 3.2 - The paper State-Level Cancer Mortality...Ch. 3.2 - The accompanying data on seat belt use for each of...Ch. 3.2 - The previous exercise gave data on seat belt use...Ch. 3.2 - The U.S. Department of Health and Human Services...Ch. 3.2 - The article Economy Low, Generosity High (USA...Ch. 3.2 - The U.S. gasoline tax per gallon data for each of...Ch. 3.2 - A report from Texas Transportation Institute...Ch. 3.2 - The percentage of teens not in school or working...Ch. 3.3 - The data in the accompanying table are from the...Ch. 3.3 - The accompanying data on annual maximum wind speed...Ch. 3.3 - The accompanying relative frequency table is based...Ch. 3.3 - The data in the accompanying table represents the...Ch. 3.3 - Construct a histogram for the data in the previous...Ch. 3.3 - The following two relative frequency distributions...Ch. 3.3 - U.S. Census data for San Luis Obispo County,...Ch. 3.3 - Use the commute time data given in the previous...Ch. 3.3 - The report Trends in College Pricing 2012...Ch. 3.3 - An exam is given to students in an introductory...Ch. 3.3 - The accompanying frequency distribution summarizes...Ch. 3.3 - Example 3.19 used annual rainfall data for...Ch. 3.3 - Use the relative frequency distribution...Ch. 3.3 - Prob. 37ECh. 3.3 - Use the cumulative relative frequencies given in...Ch. 3.3 - Using the five class intervals 100 to 120, 120 to...Ch. 3.4 - The accompanying table gives data from a survey of...Ch. 3.4 - Consumer Reports Health (consumerreports.org) gave...Ch. 3.4 - Consumer Reports rated 29 fitness trackers (such...Ch. 3.4 - Consumer Reports (consumerreports.org) rated 37...Ch. 3.4 - The Solid Waste Management section of the...Ch. 3.4 - The report Daily Cigarette Use: Indicators on...Ch. 3.4 - The accompanying time series plot of movie box...Ch. 3.5 - The accompanying comparative bar chart is similar...Ch. 3.5 - The figure at the top left of the next page is...Ch. 3.5 - The figure at the top right of the next page is...Ch. 3.5 - The two graphical displays below are similar to...Ch. 3.5 - The following graphical display is similar to one...Ch. 3.5 - Explain why the following graphical display...Ch. 3 - Each year, The Princeton Review conducts surveys...Ch. 3 - Prob. 55CRCh. 3 - Prob. 56CRCh. 3 - Prob. 57CRCh. 3 - Prob. 58CRCh. 3 - Does the size of a transplanted organ matter? A...Ch. 3 - Prob. 60CRCh. 3 - The article Tobacco and Alcohol Use in G-Rated...Ch. 3 - Prob. 62CRCh. 3 - Prob. 63CRCh. 3 - Many nutritional experts have expressed concern...Ch. 3 - Americium 241 (241Am) is a radioactive material...Ch. 3 - Does eating broccoli reduce the risk of prostate...Ch. 3 - An article that appeared in USA TODAY (August 11,...Ch. 3 - Sometimes samples are composed entirely of...Ch. 3 - Prob. 4CRECh. 3 - More than half of Californias doctors say they are...Ch. 3 - Based on observing more than 400 drivers in the...Ch. 3 - An article from the Associated Press (May 14,...Ch. 3 - Prob. 8CRECh. 3 - Prob. 9CRECh. 3 - Prob. 10CRECh. 3 - The article Determination of Most Representative...Ch. 3 - The paper Lessons from Pacemaker Implantations...Ch. 3 - How does the speed of a runner vary over the...Ch. 3 - Prob. 14CRECh. 3 - One factor in the development of tennis elbow, a...Ch. 3 - An article that appeared in USA TODAY (September...
Knowledge Booster


Learn more about
Need a deep-dive on the concept behind this application? Look no further. Learn more about this topic, statistics and related others by exploring similar questions and additional content below.Similar questions
- A Bloomberg Businessweek North American subscriber study collected data from a sample of 2861 sub-scribers. Fifty- nine percent of the respondents indicated an annual income of $ 75,000 or more, and 50% reported having an American Express credit card. a. What is the population of interest in this study? b. Is annual income a categorical or quantitative variable? c. Is ownership of an American Express card a categorical or quantitative variable? d. Does this study involve cross- sectional or time series data? e. Describe any statistical inferences Bloomberg Businessweek might make on the basis of the survey.arrow_forwardA Bloomberg Businessweek North American subscriber study collected data from asample of 2861 subscribers. Fifty-nine percent of the respondents indicated an annualincome of $75,000 or more, and 50% reported having an American Express credit card.a. What is the population of interest in this study?b. Is annual income a categorical or quantitative variable?arrow_forwardWhich of these gives the best measure of central tendency for the given data?arrow_forward
- Under what circumstances would the trendline be significantly deviated by an outlier?arrow_forwardFormulate a table with a statistically non-significant p-value based on academic performance of the students in the English class is related to their timeliness in passing assignments.arrow_forwardUse the frequency distribution from Exercise 14 in Section 2-1 to construct a histogram. Does it appear to be the graph of data from a population with a normal distribution?arrow_forward
- The survey results are displayed in the segmented bar chart. Does there appear to be an association between education level and belief in the theory of evolution? If so, what does it mean about these two variables?arrow_forwardWhich of these designs can be described as a snapshot in time? Cohort Cross-sectional Quasi-experimental Case-Controlarrow_forwardWhich measure(s) of central tendency, if any, are presented in this table?arrow_forward
- Forecast the average number of viewers during the 2009 season using a three-period weighted moving average with weights 3, 2, and 1, applying 3 to the most recent data and 1 to the oldest data.arrow_forwardBased on the hourly incomes (in US dollars) of employees in two different branches at Citibank, which set of incomes has the most variability? You do not have to calculate anything, but you can if you want to. Just take a look at the incomes and determine which set has the most variability based on the definition.arrow_forwardAccording to the World Health Organization, obesity has reached epidemic proportions globally. While obesity has generally been linked with chronic disease and disability, researchers argue that it may also affect wages. In other words, the body mass index (BMI) of an employee is a predictor for salary. (A person is considered overweight if his/her BMI is at least 25 and obese if BMI exceeds 30.) The accompanying data file includes salary (in $1,000s) for 30 college-educated men with their respective BMI and a dummy variable that represents 1 for a white man and 0 otherwise. Salary BMI White 34 33 1 43 26 1 44 26 1 34 35 0 34 36 1 53 20 1 42 20 0 37 26 1 35 28 1 46 22 1 46 20 1 34 35 0 45 26 1 33 34 0 25 29 0 32 30 1 46 18 0 31 31 0 54 19 1 37 23 0 42 27 1 38 30 1 45 18 0 38 26 0 41 28 1 39 28 1 50 20 1 41 26 1 38 28 1 45 21 1 1. Estimate a model for Salary with BMI and White as the predictor variables. Note: Negative…arrow_forward
arrow_back_ios
SEE MORE QUESTIONS
arrow_forward_ios
Recommended textbooks for you
 Big Ideas Math A Bridge To Success Algebra 1: Stu...AlgebraISBN:9781680331141Author:HOUGHTON MIFFLIN HARCOURTPublisher:Houghton Mifflin Harcourt
 Glencoe Algebra 1, Student Edition, 9780079039897...AlgebraISBN:9780079039897Author:CarterPublisher:McGraw Hill
Big Ideas Math A Bridge To Success Algebra 1: Stu...
Algebra
ISBN:9781680331141
Author:HOUGHTON MIFFLIN HARCOURT
Publisher:Houghton Mifflin Harcourt
Glencoe Algebra 1, Student Edition, 9780079039897...
Algebra
ISBN:9780079039897
Author:Carter
Publisher:McGraw Hill
Statistics 4.1 Point Estimators; Author: Dr. Jack L. Jackson II;https://www.youtube.com/watch?v=2MrI0J8XCEE;License: Standard YouTube License, CC-BY
Statistics 101: Point Estimators; Author: Brandon Foltz;https://www.youtube.com/watch?v=4v41z3HwLaM;License: Standard YouTube License, CC-BY
Central limit theorem; Author: 365 Data Science;https://www.youtube.com/watch?v=b5xQmk9veZ4;License: Standard YouTube License, CC-BY
Point Estimate Definition & Example; Author: Prof. Essa;https://www.youtube.com/watch?v=OTVwtvQmSn0;License: Standard Youtube License
Point Estimation; Author: Vamsidhar Ambatipudi;https://www.youtube.com/watch?v=flqhlM2bZWc;License: Standard Youtube License