
Exploring Economics
8th Edition
ISBN: 9781544336329
Author: Robert L. Sexton
Publisher: SAGE Publications, Inc
expand_more
expand_more
format_list_bulleted
Question
Chapter 4, Problem 11P
To determine
(a)
Define the Shift and movements from
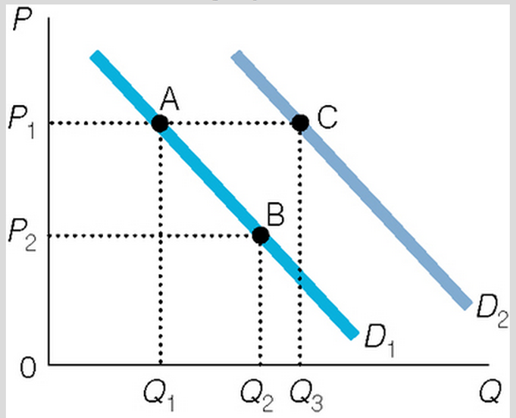
To determine
(b)
Define the movement from B and A in the given graph.
To determine
(c)
Define the shift of movement from A to B in the given graph.
To determine
(d)
Define the movement and shift from
Expert Solution & Answer

Trending nowThis is a popular solution!

Students have asked these similar questions
What is the difference between movement along the demand and supply curve due to a change
By using diagram, show the impact of a shift of demand or supply on the equilibrium point.
The following graph shows the market demand for new homes in a local community. Suppose that a recent increase in the crime rate reduces the rate at which new families move into the town.
Show the impact of the crime wave by shifting the demand curve on the following graph.
Knowledge Booster

Similar questions
- Using the table, for each line item and its associated column, describe how the market for each specific product will be affected by the associated event indicating whether it will rise, fall, or no change. For example, in the first line item for the market of corn, based upon the event of a severe drought, the price will either rise or fall or no change, demand curve will shift left (fall) or right (rise) or no change, supply curve will shift left (fall) or shift right (rise) or no change, quantity demanded will rise, fall, or no change, and quantity supplied will either rise, fall, or no change. Event Market for: Price Demand Curve Supply Curve Quantity Demanded Quantity Supplied A severe drought hits the Midwest corn growers Corn The U.S. government reduces taxes on imported lumber New Home Building The federal government raises the minimum wage from $7.25 per hour to $11.00 per hour Minimum wage jobs…arrow_forwardwhat are some of the determinants of demand shifts?arrow_forwardIn an analysis of the market for paint, an economist discovers the facts listed below. For each fact, draw a D&S diagram and provide an changed determinants that affect supply or demand, and in what direction (draw the original and resulting D and S curves and resulting P*, Q*). There have recently been some important cost-saving inventions in the technology for making paint.arrow_forward
- Look at the graph and answer the following questions? A. If the labor market shows that wages are 120,000, how many employees should the firm hire? B Explain why the curve does not show a straight line C. Discuss whether you can hire a lot more than 60 employees for a very low salary. D. List three factors that can make the demand curve shift to the rightarrow_forwardD) What can cause a movement from Point C to Point D. Briefly explain your position. E) What can cause a movement from Point C to Point B. Briefly explain your position.arrow_forwardGraphically illustrate how each of the following events, ceteris paribus, will affect the market for coffee. (Start new graph for each question.) Your diagrams must include initial and subsequent, prices, quantities, curves, equilibriums and related movements along a curve. The price of tea increases. Coffee workers organize themselves into a union and gain higher wages. Coffee is shown to cause cancer in laboratory rats. Coffee prices are expected to rise rapidly in the near future.arrow_forward
- Graphically show how each of the following shifts the supply curve. Also identify which factor of supply is being affected in each case. a) You are an Oil seller. You hear that after 2 months, the price of Oil will go down. How will it affect your current supply of Oil? b) Beef and Leather are complements in production. If the price of Beef increases, how will it affect the supply of Leather? c) If the price of Potatoes increases, how does it affect the supply of French Fries?arrow_forwardWill demand curves have the same exact shape in all markets? If not, how will they differ? What causes market demand to decrease (i.e., causes the market demand curve to shift down and to the left)?arrow_forwardWhat is a demand curve and a supply curve?arrow_forward
- Suppose that the price of basketball tickets at your college is determined by market forces. Currently, the demand and supply schedules are as follows: Price Quantity Demanded Quantity Supplied (Dollars) (Tickets) (Tickets) 4 10,000 8,000 8 8,000 8,000 12 6,000 8,000 16 4,000 8,000 20 2,000 8,000 Use the blue points (circle symbol) to graph the demand for basketball tickets. Then use the orange points (square symbol) to graph the supply of tickets. Finally, use the black point (plus symbol) to indicate the equilibrium price and quantity in this market. Original DemandSupplyOriginal EquilibriumNew DemandNew Equilibrium0246810121416182020181614121086420Price of Tickets (Dollars)Quantity of Tickets (Thousands) Your college plans to increase total enrollment next year by 5,000 students. The additional students will have the following demand schedule: Price Quantity Demanded (Dollars) (Tickets) 4 4,000 8 3,000 12 2,000…arrow_forwardIn terms of our shift variables of demand and supply, how are each of the following pairs related? Which side of the market for the second good (supply or demand) is affected by the change in the price of the first good. d. crackers and peanut butter e. cotton and dress shirtsf. neckties and dress shirts g. leather and shoesh. socks and shoesarrow_forwardReplacement car parts are an inferior good. The country is going through a recession. Simultaneously, the price of a key raw material used in making replacement car parts goes down. What happens to the price and output of replacement car parts? Briefly explain. Briefly explain. In addition, show this graphically by choosing the appropriate graph from the four graphs (A - D) in the picture belowarrow_forward
arrow_back_ios
SEE MORE QUESTIONS
arrow_forward_ios
Recommended textbooks for you
- Exploring EconomicsEconomicsISBN:9781544336329Author:Robert L. SextonPublisher:SAGE Publications, Inc
Exploring Economics
Economics
ISBN:9781544336329
Author:Robert L. Sexton
Publisher:SAGE Publications, Inc