
Videos
Use the following information for P4—17 and P4—18:
The Hershey Company is one of the world’s leading producers of chocolates, candies, and confections. It sells chocolates and candies, mints and gums, baking ingredients, toppings, and beverages. Hershey’s consolidated balance sheets for 20X2 and 20X3 follow.
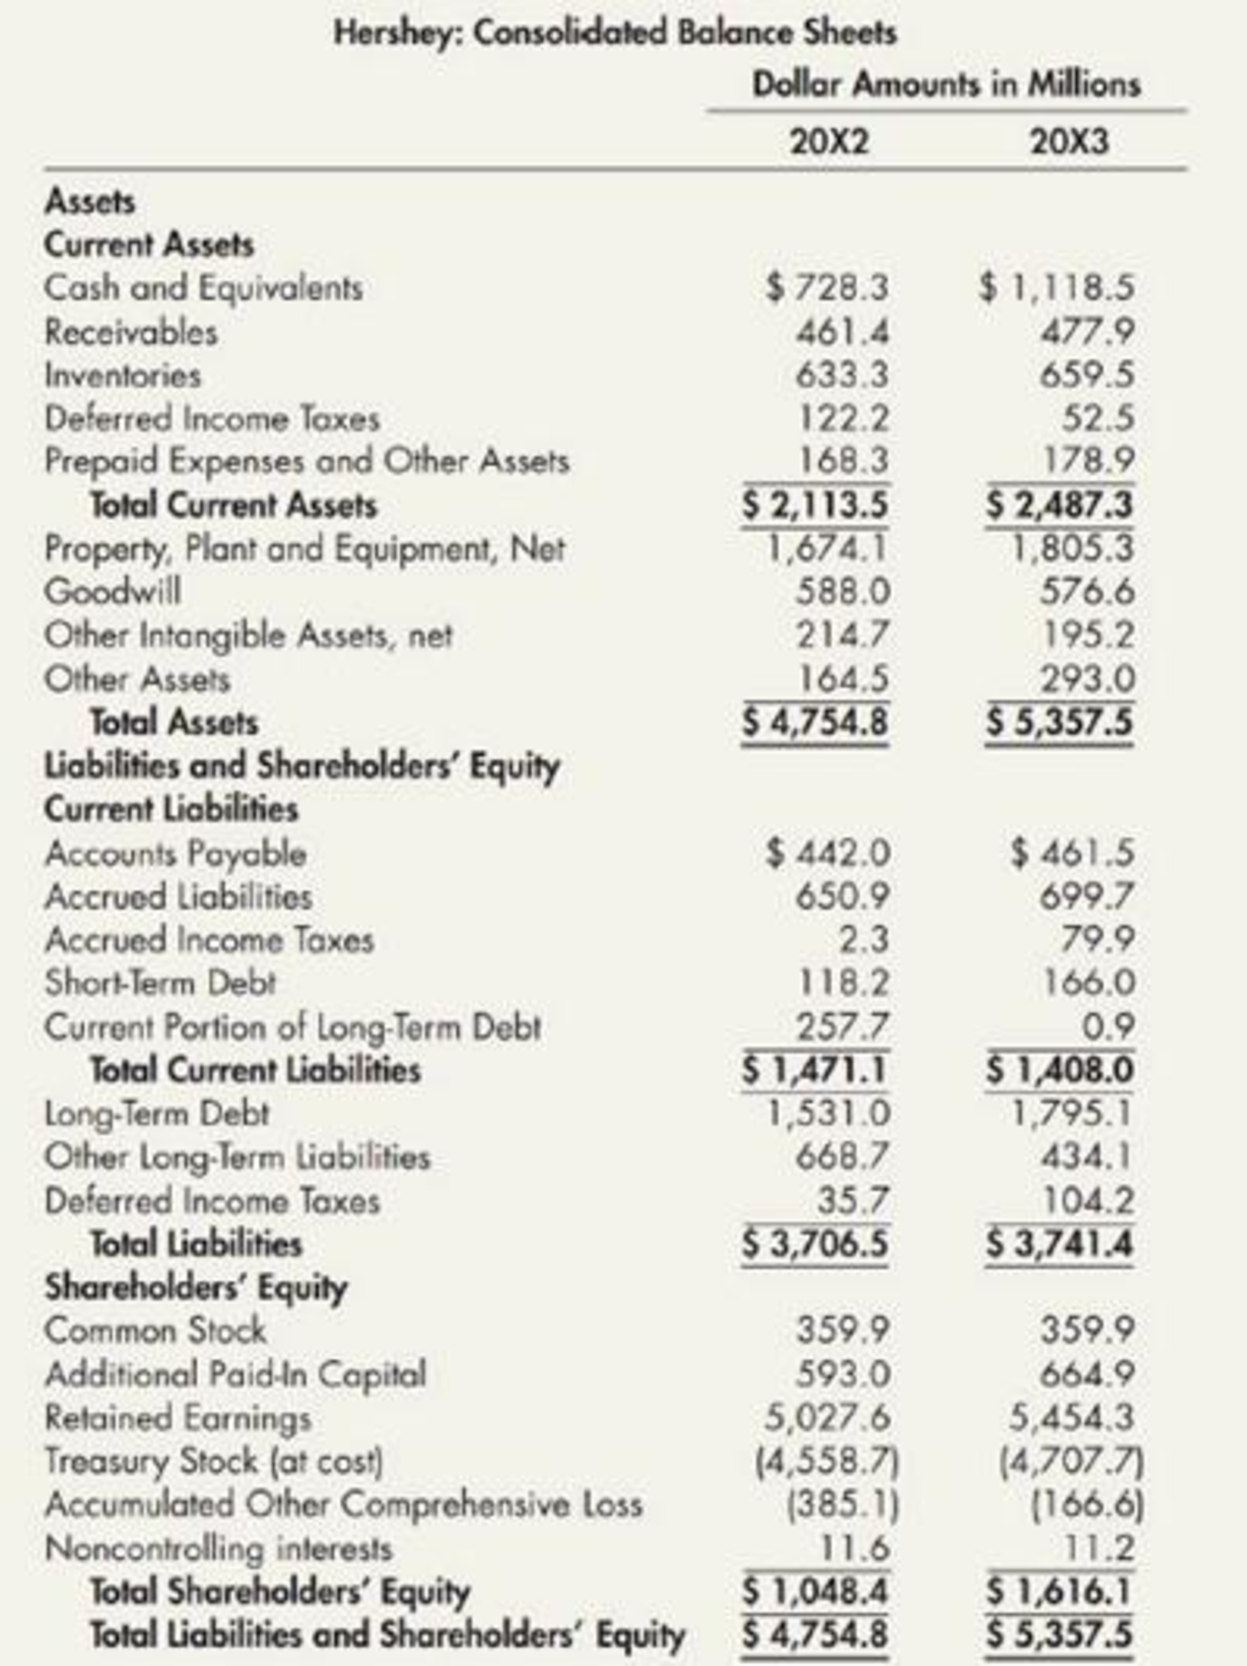
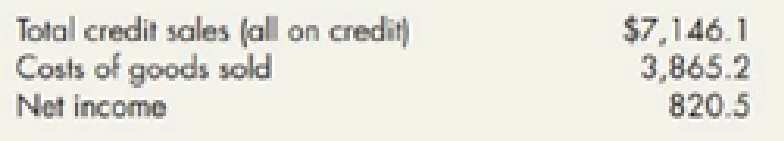
Ratios Analysis: Hershey Refer to the information for Hershey On the preceding page. Additional information for 20X3 is as follows (amounts in millions):
Required:
Next Level Compute the following ratios for 20X3. Provide a brief description of what each ratio reveals about Hershey.
- 1. return on common equity
- 2. debt-to-assets
- 3. debt-to-equity
- 4. current
- 5. quick (Hershey uses cash and equivalents, short terms securities, and receivables in their quick ratio calculation.)
- 6. inventory turnover days
- 7. accounts receivable turnover days
- 8. accounts payable turnover days
- 9. operating cycle (in days)
- 10. total asset turnover
Requirement 1:
Determine the return on common equity ratio of Company H for 20X3.
Explanation of Solution
Determine the return on common equity ratio of Company H for 20X3:
Step 1: Calculate the average total common stockholders’ equity.
Step 2: Calculate the return on common equity ratio of C&C Incorporation for 20X3.
Hence, the return on common equity ratio of Company H for 20X3 is 0.616.
Comment:
Return on common equity ratio indicates that Company H generated a 61.6% return for its common shareholders.
Requirement 2:
Determine the debt-to-assets ratio of Company H for 20X3.
Explanation of Solution
Determine the debt-to-assets ratio of Company H for 20X3:
Hence, the debt-to-assets ratio of Company H for 20X3 is 0.698.
Comment:
Debt-to-assets ratio indicates that Company H’s 69.8% of total assets are financed by its creditors.
Requirement 3:
Determine the debt-to-equity ratio of Company H for 20X3.
Explanation of Solution
Determine the debt-to-equity ratio of Company H for 20X3:
Hence, the debt-to- equity ratio of Company H for 20X3 is 2.32.
Comment:
Debt-to-assets ratio indicates that Company H has $2.32 in total liabilities for every of $1.00 in equity.
Requirement 4:
Determine the current ratio of Company H for 20X3.
Explanation of Solution
Determine the current ratio of Company H for 20X3:
Hence, the current ratio of Company H for 20X3 is 1.77.
Comment:
Current ratio indicates that Company H has $1.77 in current assets for every of $1.00 in current liabilities.
Requirement 5:
Determine the quick ratio of Company H for 20X3.
Explanation of Solution
Determine the quick ratio of Company H for 20X3:
Hence, the quick ratio of Company H for 20X3 is 1.13.
Comment:
Quick ratio indicates that Company H has $1.13 in quick assets (cash and receivables) for every of $1.00 in current liabilities.
Requirement 6:
Determine the inventory turnover in days of Company H for 20X3.
Explanation of Solution
Determine the inventory turnover in days of Company H for 20X3:
Step 1: Calculate the average inventory.
Step 2: Calculate the inventory turnover.
Step 3: Calculate the inventory turnover in days of C&C Incorporation for 20X3.
Hence, the inventory turnover days of Company H for 20X3 are 61 days.
Comment:
On an average Company H takes 61 days to convert inventory into sales in the operation cycle.
Requirement 7:
Determine the accounts receivable turnover in days of Company H for 20X3.
Explanation of Solution
Determine the accounts receivable turnover in days of Company H for 20X3:
Step 1: Calculate the average accounts receivable.
Step 2: Calculate the accounts receivable turnover.
Step 3: Calculate the accounts receivable turnover in days of C&C Incorporation for 20X3.
Hence, the accounts receivable turnover days of Company H for 20X3 are 24 days.
Comment:
On an average Company H takes 24 days to collect its receivables from its customers.
Requirement 8:
Determine the accounts payable turnover in days of Company H for 20X3.
Explanation of Solution
Determine the accounts payable turnover in days of Company H for 20X3.
Step 1: Determine the amount of inventory purchases.
Step 2: Calculate the average accounts payable.
Step 3: Calculate the accounts payable turnover.
Step 4: Determine the accounts payable turnover in days.
Hence, the accounts payable turnover in days of Company H for 20X3 is 42 days.
Comment:
On an average Company H takes 42 days to pay its payables to its suppliers.
Requirement 9:
Determine the operating cycle in days of Company H for 20X3.
Explanation of Solution
Determine the operating cycle in days of Company H for 20X3:
Hence, the operating cycle in days of Company H for 20X3 is 43 days.
Comment:
Company H takes 43days to complete an operating cycle (the purchase of inventory and collection of cash from accounts receivable).
Requirement 10:
Determine the total assets turnover ratio of Company H for 20X3.
Explanation of Solution
Determine the total assets turnover ratio of Company H for 20X3:
Step 1: Calculate average total assets.
Step 2: Calculate the total assets turnover ratio of C&C Incorporation for 20X3.
Hence, the total assets turnover ratio of Company H for 20X3 is 1.41.
Comment:
Total assets turnover ratio indicates that Company H has generated $1.41 in sales for every of $1.00 in assets
Want to see more full solutions like this?
Chapter 4 Solutions
Intermediate Accounting: Reporting And Analysis


- Use following formation for P4-15 and P4-16: McCormick Company, Inc. is one of the worlds leading producers of spices, herbs, seasonings, condiments, and other flavorings for foods. Its products are sold to consumers, with some of the leading brands of spices and seasonings, as well as to industrial producers of foods. McCormicks consolidated balance sheets for 20X2 and 20X3 follow. Common-Size and Rate of Change Analyses: McCormick Refer to the information for McCormick above. Required: Compute the common size balance sheet for 20X3 and the rate of change balance sheet for 20X3. Which two asset accounts and which two liabilities and shareholders equity accounts are the largest relative to total assets in 20X3? Which two asset accounts and which two liability and shareholders equity accounts grew at the fastest rates in 20X3? (Note: You may find it helpful to enter the data into an Excel spreadsheet for these computations.)arrow_forwardRecent balance sheet information for two companies in the food industry, Mondelez International, Inc. (MDLZ), and The Hershey Company (HSY), is as follows (in thousands): Mondelez Hershey Net property, plant, and equipment $8,229,000 $2,177,248 Current liabilities 14,417,000 1,909,443 Long-term debt 13,217,000 2,347,455 Other long-term liabilities 8,689,000 439,748 Stockholders' equity 25,215,000 827,687 a. Determine the ratio of liabilities to stockholders' equity for both companies. Round to one decimal place. Mondelez fill in the blank 1 Hershey fill in the blank 2 b. Determine the ratio of fixed assets to long-term liabilities for both companies. Round to one decimal place. Mondelez fill in the blank 3 Hershey fill in the blank 4arrow_forwardRecent balance sheet information for two companies in the food industry, Mondelez International, Inc. and The Hershey Company, is as follows (in thousands): Mondelez HersheyNet property, plant, and equipment $10,010,000 $1,674,071Current liabilities 14,873,000 1,471,110Long-term debt 15,574,000 1,530,967Other long-term liabilities 12,816,000 716,013Stockholders’ equity 32,215,000 1,036,749a. Determine the ratio of liabilities to stockholders’ equity for both companies. Round to one decimal place.b. Determine the ratio of fixed assets to long-term liabilities for both companies. Round to one decimal place.c. Interpret the ratio differences between the two companies.arrow_forward
- GF Foods Company is a large, primarily domestic, consumer foods company involved in the manufacture, distribution, and sale of a variety of food products. Industry averages are derived from Troy’s The Almanac of Business and Industrial Financial Ratios. Following are the 2024 and 2023 comparative balance sheets for IGF. (The financial data we use are from actual financial statements of a well-known corporation, but the company name used is fictitious, and the numbers and dates have been modified slightly.) IGF FOODS COMPANY Comparative Balance Sheets Years Ended December 31, 2024 and 2023 ($ in millions) 2024 2023 Assets Current assets: Cash $ 48 $ 142 Accounts receivable 347 320 Marketable securities 358 – Inventories 914 874 Prepaid expenses 212 154 Total current assets $ 1,879 $ 1,490 Property, plant, and equipment (net) 2,592 2,291 Intangibles (net) 800 843 Other assets 74 60 Total assets $ 5,345 $ 4,684 Liabilities and Shareholders’…arrow_forwardRatios Analyses: McCormick McCormick & Company, Inc. is one of the world's leading producers of spices, herbs, seasonings, condiments, and other flavorings for foods. Its products are sold to consumers, with some of the leading brands of spices and seasonings, as well as to industrial producers of foods. McCormick's consolidated balance sheets for 20X2 and 20X3 follow. McCormick: Consolidated Balance Sheets Dollar Amounts in Millions 20X2 20X3 Assets Current Assets Cash and Equivalents $79.0 $63.0 Receivables 465.9 495.5 Inventories 615.0 676.9 Prepaid Expenses and Other Assets 125.5 134.8 Total Current Assets $1,285.4 $1,370.2 Property and Equipment, Net 547.3 576.6 Goodwill 1,695.3 1,798.5 Intangible Assets, net 323.5 333.4 Investments and Other Assets 313.9 371.0 Total Assets $4,165.4 $4,449.7 Liabilities and Shareholders' Equity Current Liabilities Short-Term Borrowings $140.3 $211.6 Current…arrow_forwardCompare Income Statements and Balance Sheets of Competitorsa. Following are selected income statement data from two European grocery chain companies: Tesco PLC (UK) and Ahold (the Netherlands). Prepare a common‑size income statement. To do this, express each income statement amount as a percent of sales.Note: Round percentage to one decimal point (for example, round 18.566% to 18.6%). Income Statements Tesco Carrefour Group For Fiscal Year Ended February 24, 2019 December 31, 2018 (£ millions) (€ millions) Sales £57,520 Answer €70,125 Answer Cost of goods sold 53,790 Answer 54,765 Answer Gross profit 3,730 Answer 15,360 Answer Total expenses 2,542 Answer 15,670 Answer Net income £1,188 Answer €(310) Answer b. Following are selected balance sheet data from two European grocery chain companies: Tesco PLC (UK) and Ahold (the Netherlands). Prepare a common‑size balance sheet. To do this, express each…arrow_forward
- The following table shows income statement and balance sheet data for five U.S. industries in 2017. INCOME STATEMENT AND BALANCE SHEET FOR 2017SELECTED U.S. INDUSTRIES FOR 2017(Figures in $ billions) Food Pharmaceuticals Oiland Coal Computers andPeripherals FoodStores Income Statement Data: Sales $ 666.9 $ 427.5 $ 802.0 $ 216.0 $ 474.2 Cost of goods sold 596.1 352.4 757.8 189.7 451.0 Balance Sheet Data: Inventory $ 67.8 $ 56.8 $ 44.2 $ 11.3 $ 27.9 Accounts receivable 56.6 68.1 52.8 23.7 7.4 Accounts payable 49.0 42.3 50.3 39.5 23.7 Note: Cost of goods sold includes selling, general, and administrative expenses. Source: U.S. Department of Commerce, Quarterly Financial Report for Manufacturing, Mining, Trade Corporations, and Selected Service Industries,…arrow_forwardHasbro, Inc. and Mattel, Inc. are the two largest toy companies in North America. Condensed liabilities and stockholders’ equity from a recent balance sheet are shown for each company as follows (in thousands): Please see the attachment for details: a. Determine the ratio of liabilities to stockholders’ equity for both companies. Round toone decimal place.b. Determine the times interest earned ratio for both companies. Round to one decimalplace.c. Interpret the ratio differences between the two companies.arrow_forwardMinden Company is a wholesale distributor of premium European chocolates. The company’s balancesheet as of April 30 is given below:Minden CompanyBalance SheetApril 30AssetsCash ................................................................................................... $ 9,000Accounts receivable ........................................................................... 54,000Inventory ............................................................................................ 30,000Buildings and equipment, net of depreciation .................................... 207,000Total assets ........................................................................................ $300,000Liabilities and Stockholders’ EquityAccounts payable ............................................................................... $ 63,000Note payable ...................................................................................... 14,500Capital stock, no par…arrow_forward
- Mason Company has prepared consolidated financial statements for the current year and is now gathering information in connection with the following five operating segments it has identified. CompanyTotal Books Computers Maps Travel Finance Sales to outside parties $ 1,547 $ 121 $ 696 $ 416 $ 314 $ 0 Intersegment sales 421 24 240 39 118 0 Interest income—external 97 60 0 0 0 37 Interest income—intersegment loans 147 0 0 0 0 147 Assets 3,398 206 1,378 248 326 1,240 Operating expenses 1,460 115 818 304 190 33 Expenses—intersegment sales 198 70 51 31 46 0 Interest expense—external 107 0 0 0 0 107 Interest expense—intersegment loans 147 21 71 38 17 0 Income tax…arrow_forwardSmart Eletro plc, a public listed company, is a major supplier of electrical components to the automotive industry. Company’s key accounting ratios are set out in the following table, together with industry averages: Smart Electro plc.Industry AveragesReturn on capital employed 21.4%16.1%Gross profit margin 11.5%13.0%Net profit margin 9.8%11.0%Current ratio 1.61.4Inventories turnover 126Trade receivables collection period 61 days65 daysTrade payables payment period 43 days105 daysGearing 68.4%37.2%Questions:b) Smart Eletro plc. has operations in the United Kingdom, Europe and the United States. The company has been looking for some time to expand its operations into the Far East and has now formulated plans for the building of two major new factories in China. Explain in detail the best possible internal and external financing options available to the company to expand its operations taking into account the company’s gearing and profitability position.arrow_forwardMinden Company is a wholesale distributor of premium European chocolates. The company’s balance sheet as of April 30 is given below: Minden CompanyBalance SheetApril 30 Assets Cash $ 18,700 Accounts receivable 70,250 Inventory 41,250 Buildings and equipment, net of depreciation 230,000 Total assets $ 360,200 Liabilities and Stockholders’ Equity Accounts payable $ 72,250 Note payable 13,700 Common stock 180,000 Retained earnings 94,250 Total liabilities and stockholders’ equity $ 360,200 The company is in the process of preparing a budget for May and has assembled the following data: Sales are budgeted at $214,000 for May. Of these sales, $64,200 will be for cash; the remainder will be credit sales. One-half of a month’s credit sales are collected in the month the sales are made, and the remainder is collected in the following month. All of the April 30 accounts receivable will be collected in May. Purchases of inventory are…arrow_forward
- Intermediate Accounting: Reporting And AnalysisAccountingISBN:9781337788281Author:James M. Wahlen, Jefferson P. Jones, Donald PagachPublisher:Cengage Learning
 Managerial Accounting: The Cornerstone of Busines...AccountingISBN:9781337115773Author:Maryanne M. Mowen, Don R. Hansen, Dan L. HeitgerPublisher:Cengage Learning